
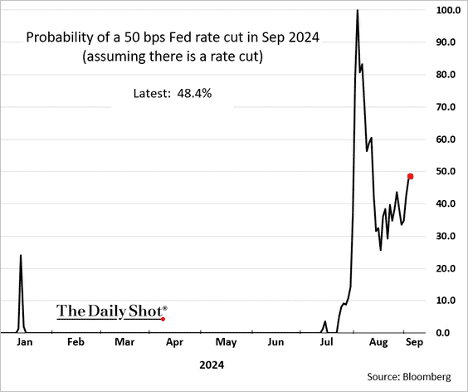
Following the softer job openings data, the market is now assigning even odds to a 50 bps rate cut this month. The key data point will be the August jobs report on Friday.

Source: Reuters Read full article
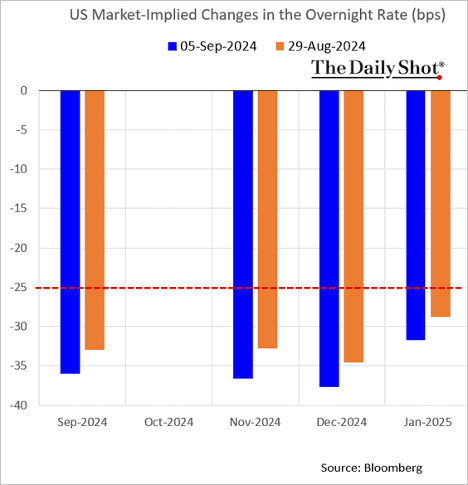
In fact, the market has priced in a substantial probability of 50 bps rate cuts for each of the next several FOMC meetings.
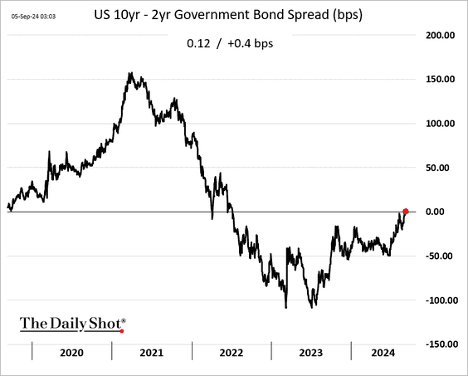
The Treasury curve has disinverted as soft labor data fuels expectations of Fed rate cuts.
The August jobs report will determine whether the Fed opts for a 25 bps or 50 bps rate cut. Here is the short-term volatility curve.
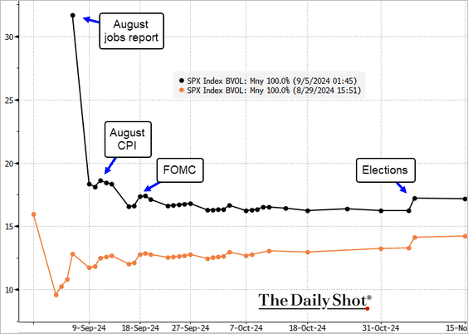
Source: @TheTerminal, Bloomberg Finance L.P.
The ADP private employment report revealed the smallest gain in August since 2021.
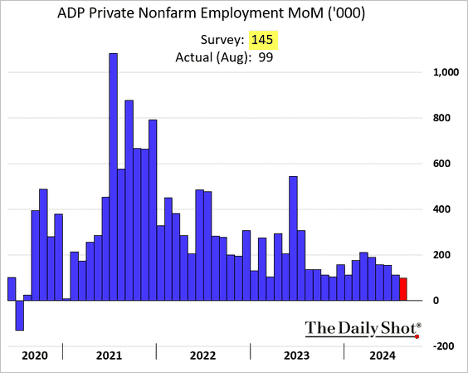
Source: CNBC Read full article
Friday’s jobs report was the last before the September FOMC meeting, giving it more than the usual importance. The continuing slowdown in hiring activity should be enough to justify looser Fed policy. The question now is not whether they will cut rates, but by how much.
Key Points:
- August payrolls grew by 142,000 and the two prior months followed the recent pattern with downward revisions.
- The headline unemployment rate ticked down to 4.2% due to growth in the labor force.
- Average hourly earnings rose 0.4% for the month and were up 3.8% in the last year.
- The healthcare/social assistance and leisure/hospitality sectors accounted for most of the private sector job growth.
- Three-month average job growth now stands at 116,000 vs. 251,000 for the full year 2023.
We still have two weeks until the FOMC meeting and more data to come, but it seems only a giant change would shake the Fed off course. Powell said in his Jackson Hole speech “the time has come” for a policy shift. Now they’re simply deciding the details.
The Fed may be poised to loosen short-term rates, but the Treasury is doing the opposite. Possibly because it has little choice as the debt continues rising. Let me explain.
Borrowing as efficiently as possible is important when you are the world’s largest debtor. The Treasury has a lot of discretion on how it manages the federal debt. It needs to raise certain amounts but can borrow short-term, long-term, or anywhere in between. Treasury can also repurchase its own debt, replacing that amount with newly issued securities at a different maturity. All this activity becomes more important as the amount of debt increases, as it has been and will continue to do.
Two important things are happening right now. First, the Treasury has been shifting a larger part of its new issuance to short-term Treasury bills. That’s a bit odd since the yield curve is still inverted, although the 2–10 spread is now flat. (That’s what happens when the yield curve starts normalizing. Typically, this is followed by a recession.) They are borrowing mostly in the zone with the highest rates. But there’s a reason for it, which I’ll get to in a minute.
The other new development is the Treasury has been buying back longer-term Treasury securities. This seems to have started in April and is an ongoing effort. For example, Wolf Richter reported last month they had repurchased $2 billion in 20-year bonds that had been issued in 2020 at 1.25%.
Again, this seems odd, if not foolish. If your debt is at a historically low fixed rate, why give it up? We are unlikely to ever see such low rates again. To me this seems like an “own goal.”
The net effect of Treasury’s activity—borrowing more at the short end, injecting liquidity into the long end—is to push long-term interest rates lower. It’s a form of economic stimulus, which might be okay but could also add inflation pressure… just as the Fed thinks it has inflation on the run.
Shifting more debt to the short end means that debt will mature sooner, maybe letting the government refinance at lower long-term rates. That seems to be the bet, at least. We’ll see how it works out. But they are likely right. Lacy Hunt thinks that the Fed needs to cut about two points over the next year. The market seems to think that as well. But if Lacy is right, it also means the economy will soften more than we now think.
But the bigger point is we now have not just the Fed, but the Treasury working to push interest rates in a desired direction. And not necessarily the same direction, though we should hope they at least try to coordinate. Powell and Yellen have worked together before.
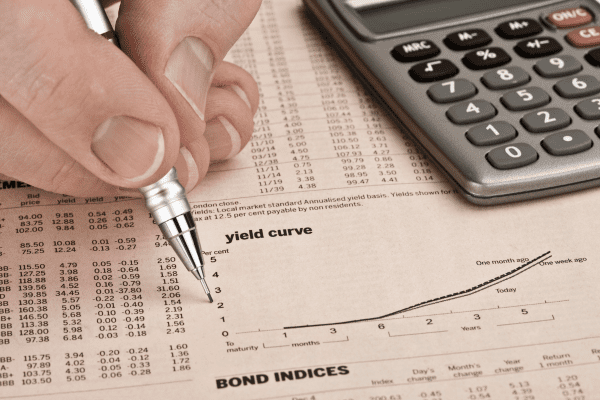
Normalized Yield Curve
This past week, the “yield curve,” or the spread between the 10-year and 2-year Treasury bond, briefly un-inverted. For our newer readers, a yield curve inversion occurs when short-term interest rates surpass long-term rates. For example, the 2-year Treasury had a higher yield for the last two years than the 10-year Treasury. Typically, longer-term investments offer higher yields than short-term ones due to the increased risk over time. However, such was not the case following the Fed’s aggressive rate hiking campaign, which pushed short-term yields higher.
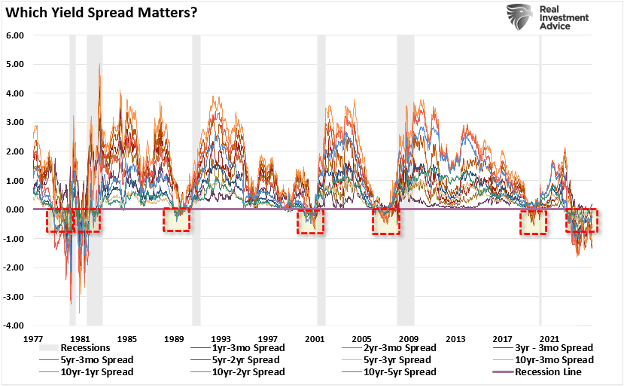
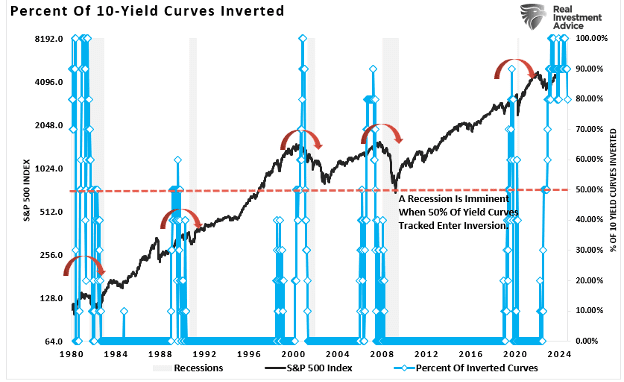
The yield curve is a graphical representation of interest rates across different maturities for bonds of similar type. Typically, we look at yield curves of government bonds, but it could also be corporate bonds, municipal bonds, etc. The chart below shows 10-different yield spreads we track. Notice that in 2019, most yield spreads inverted before the economic shutdown. In 2022, as the Fed started aggressively hiking rates, yield spreads inverted once again. Take note of the black line (the 10-year less the 2-year spread) and the blue line (the 10-year less the 3-month Treasury bill spread). These are the two spreads to which economists and investors pay the most attention.
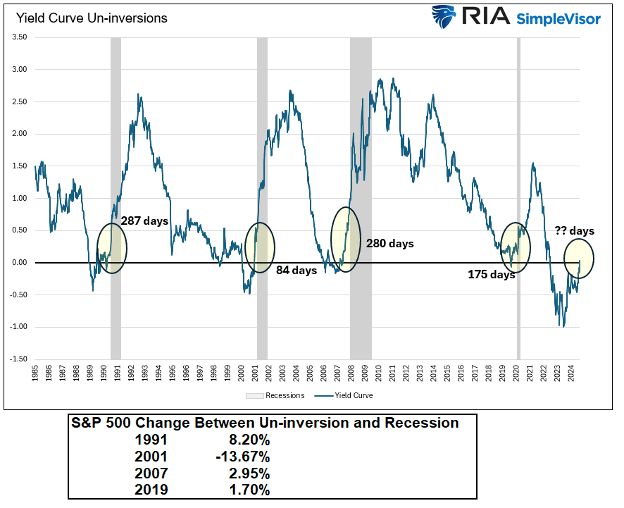
The following chart shows a more complete history of those 10-yield spreads. As shown, each time the un-inversion of those spreads previously occurred, that un-inversion preceded the onset of a recession.
That chart is a bit difficult to decipher. The following chart is a composite index of those 10-yield spreads and shows the percentage of those inverted spreads. There are two essential points to consider:
- Recessions coincide with periods where more than 50% of the yield spreads are inverted.
- Recessions follow the un-inversion of those spreads.
Historically, an inverted yield curve has been a reliable predictor of recessions. The inversion reflects a shift in investor sentiment, signaling that they expect future economic conditions to deteriorate. As a result, businesses and consumers may pull back on spending, leading to reduced economic activity and potentially triggering a recession.
However, the media often notes 1995, when the Fed cut rates, but no recession occurred. The chart above shows ZERO inversions of the 10-yield spreads in 1995. More than 50% of the spreads did not invert until 1999, and the recession of 2000 followed.
This past week, the 10-year yield spread, less the 2-year yield spread, was un-inverted. Does that mean a recession is imminent?
As noted above, while the inversion of the various yield spreads equates to economic weakness, the un-inversion is historically the “recessionary signal.” The graph below shows that a recession can take almost a year following an un-inversion.
Meanwhile, the media assumes that “this time is different” because a recession didn’t occur immediately upon the inversion. This way of thinking has two problems.
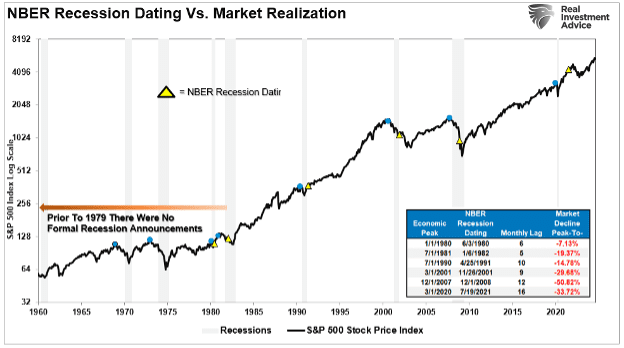
- The National Bureau of Economic Research (NBER) is the official recession dating arbiter. It waits for data revisionsby the Bureau of Economic Analysis (BEA) before announcing a recession’s official start. Therefore, the NBER is always 6-12 months late, dating the recession.
- Crucially, as noted, the recession is not denoted by the inversion of the yield curve. The inversion is the “warning sign,” whereas the un-inversion marks the start of the recession, which the NBER will recognize much later.
If you wait for the official announcement by the NBER to confirm a recession, it will be too late. To wit:
“Each of those dots is the peak of the market PRIOR to the onset of a recession. In 9 of 10 instances, the S&P 500 peaked and turned lower prior to the recognition of a recession.“
Notably, the yield curve un-inversion and onset of a recession typically follow a Fed “rate-cutting” cycle. That is because the Federal Reserve is reacting to slowing economic data, which tends to lag by a few months. As data is revised, the Fed cuts rates more aggressively to offset the deflationary pressures building in the economy. However, during these initial stages, there was “no recession,” as the NBER had not dated it yet.
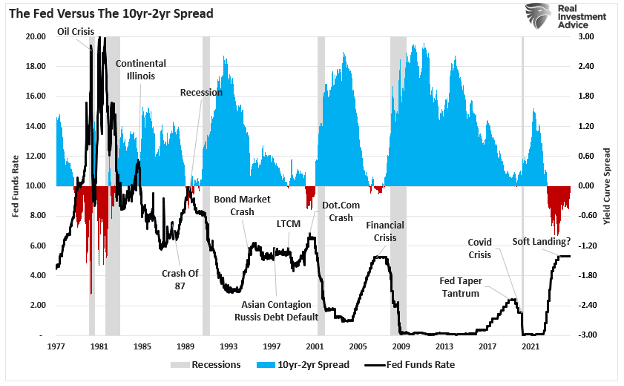
Such will likely be the case again, as the lag between the yield curve’s un-inversion and the recession dating could be anywhere from 6 to 18 months.
Great Quotes
“Each life has a profound significance – a significance that far exceeds our present understanding.” – Dr Michael Smith
Picture of the Week
Crystal Lake in the Enchantments, WA State

All content is the opinion of Brian Decker


