While many predict “surging inflation” resulting from President Trump’s plans for tariffs and increased deficit spending, a historical review for perspective is valuable. Let’s start with tariffs.
As noted above, Trump instituted tariffs in 2016 without an impact on inflation. However, a 2015 paper by the Tax Foundation gives us some additional perspective:
“Let’s travel back one hundred years to 1915. Back then, the main sources of federal revenue were very different. Almost half of all federal revenue came from excise taxes, such as taxes on liquor and tobacco. Another 30.1 percent of federal revenue came from customs duties, or tariffs, on imported foreign goods.“
In other words, 80% of all tax revenue came from excise taxes and tariffs, while individual and corporate taxes were about 6% each. That lasted until Congress passed the Revenue Act in 1942, which reduced tariffs and increased personal and corporate income taxes.
Given economists’ current concern that “Trumpflation” is returning, the historical evidence of previous tariff usage does not corroborate those concerns. The chart below shows the Federal Funds rate equivalent, the 10-year Treasury rate, and the annual change in inflation from 1915 to 1945. (Note: The U.S. economy was in a depression starting in 1933, accelerating the interest rate decline.)
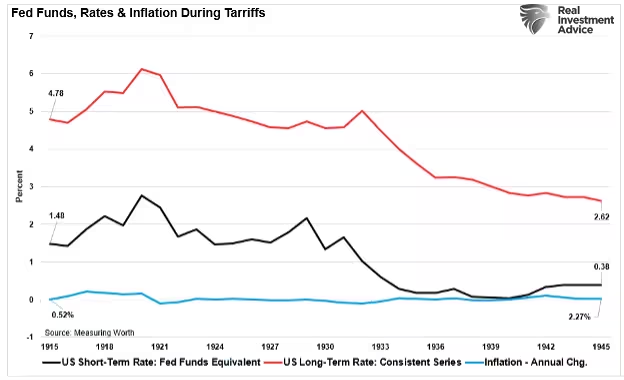
The current economic environment is very different from the early 20th century, which we will address momentarily. However, today, globalization and technology give consumers vast choices in the products they buy. While instituting a tariff on a set of products from China may indeed raise the prices of those specific products, consumers have easy choices for substitution. A recent survey by Civic Science showed an excellent example of why tariffs won’t increase prices (always a function of supply and demand).
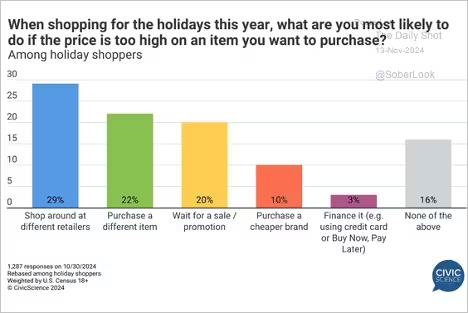
Of course, if demand drops for products with tariffs, prices will fall, reducing inflationary pressures.
However, another fallacy is that tariffs will increase inflation due to increased domestic production, leading to higher wages.
Productivity is the key to whether or not “Trumpflation” becomes a risk.
“Slow productivity growth is the leading cause of slow economic growth, and slow economic growth makes it all but impossible for everyone’s boat to rise. No wonder angry citizens want dramatic change. But while voters may see the problem in a political establishment that is out of touch, the populist politicians who are challenging that establishment are unlikely to fare better.
In the short term, they may be able to medicate the economy with a big tax cut or a dose of deficit spending. When the effects of that treatment wear off, though, the effects of slow productivity growth will linger.” – Harvard Business Review
What about the US deficit?
“Rising government debt has not correlated with higher interest rates (or inflation) over the past few decades. Since 1980, total U.S. debt as a share of GDP surged from 156% to nearly 353%, yet economic growth and interest rates slowed during that period. Despite increasing debt, the persistence of low rates and slower economic growth reflects the diversion of productive capital into non-productive debt service. In other words, debt is “deflationary” as it retards economic prosperity.”
In conclusion, concerns about “Trumpflation” are amplified by discussions of tariffs and increased government spending. However, a closer examination reveals that inflation may not rise as dramatically as feared. The normalization of supply chains, stabilizing energy prices, evolving consumer spending habits, and the backdrop of slowing global economic growth all point toward continued downward pressure on inflation. Moreover, historical evidence shows that high debt and deficits are more likely to contribute to deflation than inflation. As President Trump embarks on his second term, these factors will play a crucial role in shaping the economic outlook, likely mitigating the risk of runaway inflation and easing concerns about higher interest rates.
Markets:
Nvidia delivered another quarter of blockbuster earnings, but a slower revenue growth forecast tempered investor enthusiasm amid high expectations.
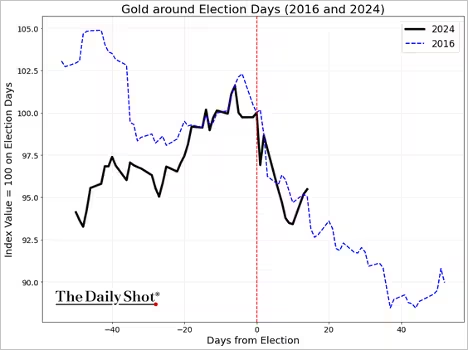
For now, gold is tracking its post-2016-election trend.
Corporate earnings growth continues to outpace GDP growth.
This chart shows current sector drawdowns from the highs.
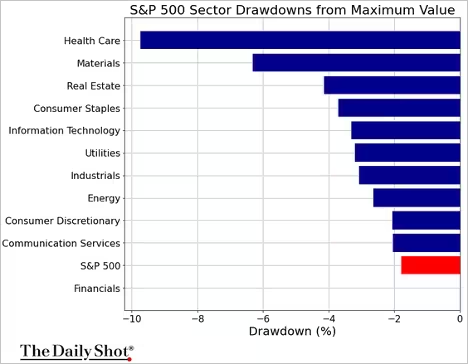
Biotech stocks have been struggling this month. The US healthcare sector is expected to outperform over the long run as the nation’s population ages. The biggest 10 US stocks now account for 21% of total global market capitalization. Improving US Fed liquidity could be a tailwind for global stocks.
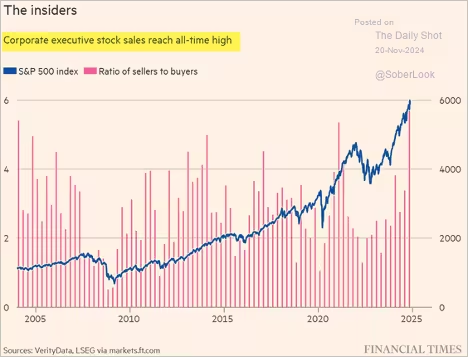
Corporate insiders have been dumping shares.
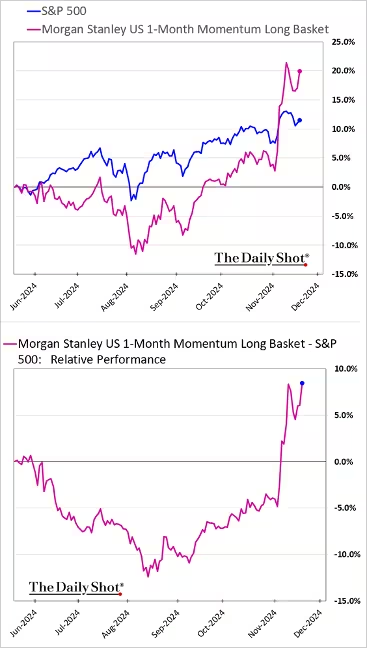
Momentum stocks continue to outperform.
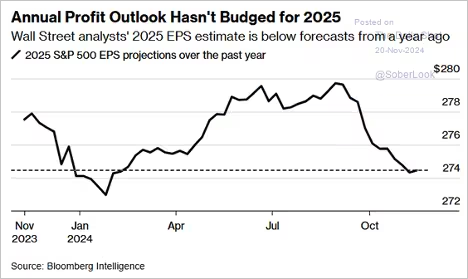
Equity mutual funds’ cash levels are at record lows. S&P 500 earnings estimates for 2025 have dropped significantly since August.
Source: @markets Read full article
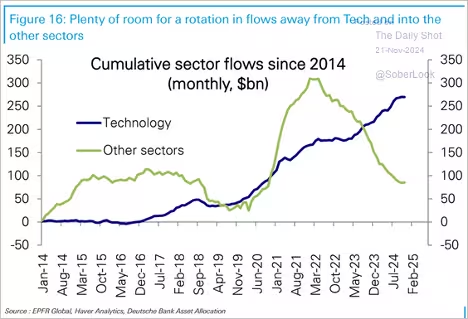
Goldman expects M&A activity to rise next year. Will we see a rotation out of tech into other sectors?
Source: Deutsche Bank Research
US equity fund inflows have hit extreme levels this year.
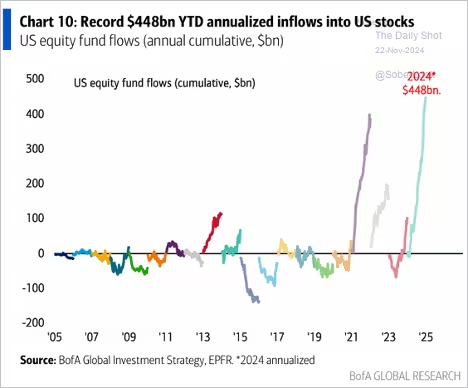
Source: BofA Global Research
Financials are seeing strong demand, while investors are exiting healthcare funds. Hedge funds are running increasingly concentrated portfolios, but they have reduced their exposure to the Magnificent 7 stocks.
Economy:
Retail trade posted a strong gain last month, boosted by vehicle sales. US factory output fell again last month, weighed down by Boeing’s challenges and the impact of the hurricanes. Capacity utilization continues to sink. The Atlanta Fed’s GDPNow estimate for Q4 GDP growth is holding at 2.5% (annualized).
Homebuilder sentiment improved further this month, with single-family unit sales expectations reaching their highest level since 2022. Existing home sales unexpectedly rose above last year’s levels in October. Building permits for single-family units improved, exceeding 2023 levels. Inventories have been moving higher. On the other hand, multifamily building permits remained soft. Multifamily units under construction have dropped 19% from last year, marking the steepest decline since 2011.
US import prices unexpectedly rose last month, but the strength of the dollar in November is expected to reverse this trend. Business applications registered a robust increase last month.
The US federal debt-to-GDP ratio has increased sharply and is projected to keep climbing.
How might a trade war affect US and global GDP growth next year? US GDP is expected to drop 0.5% if a trade war starts. Companies are increasingly discussing tariffs on earnings calls. As observed during the 2018–2019 period, consumer goods affected by tariffs experienced significant price increases.
The unemployment rate among recent college grads has risen well above the total unemployment rate. Consumer-facing companies are increasingly focused on affordability.
Last week’s initial jobless claims reached multi-year lows for this time of year, down almost 12% from 2023.
Great Quotes
“If you are not aggressive, you are not going to make money, and if you are not defensive, you are not going to keep money.” – Ray Dalio
Picture of the Week
“Beyond Crisis”, By Seype Leysin, Switzerland

All content is the opinion of Brian Decker


