65.6% of Americans own their homes, roughly the percentage that it has been for the last 50 years, down slightly the last few years. Almost 40% of homeowners own their home free and clear of any mortgage. But of those with mortgages, most have rates significantly below the 6% that used to be normal. What that means is almost 60% of America has a mortgage below 4%.
It’s also true that investors have been buying more homes. This goes back quite a few years according to Redfin’s data. Investors purchased 15.9% of all US homes sold in this year’s third quarter. That number, which has been rising for a long time, shot way up in 2021–2022 (when rates were lower!) but now seems to be returning to the previous trend. They range from individuals who own a handful of properties to large funds with thousands of homes, plus some relatively smaller mid-size investors in between. As of 2020, the US had 19.3 million rental properties which had 49.5 million rental units. Most of the properties were single units, i.e., houses. The rest were apartments, condos, etc. Individual investors owned 70.2% of the rental properties. These are, presumably, the traditional local landlords who own one or a few homes, perhaps as a sideline business. Think Airbnb, etc., which has become quite large.
Single-family rentals are owned mostly by small investors, not giant corporations. The data suggests only about 3% are owned by landlords with more than 100 properties. There are over 2 million Airbnb listings in the US out of 7 million worldwide. This Rutgers report estimates that large institutional investors owned only 574,000 single-family homes as of June 2022. If so, it supports the other estimates of large investors owning only 3%–5% of rental houses.
Generally, though, the ownership picture is exactly what you would expect. Individual investors tend to own smaller properties like single-family homes, duplexes, and small apartment buildings. The various corporate structures tend to be larger developments.
In addition to the millions who simply can’t afford to buy, a growing number of higher-income people who would once have been homeowners are choosing to rent. I think many of these want to avoid maintenance hassles or don’t like being tied down. But others have concluded owning a home may not bring the financial rewards previous generations enjoyed.
Tax policy is part of the equation. For decades following World War II, states and the federal government tried to encourage home ownership with rewards like tax deductions for mortgage interest. This was essentially a subsidy available only to those who bought homes. Renters got nothing. “The American Dream” came to include a belief that paying rent was a waste and you should buy a house as soon as you could afford it.
The 2017 tax package changed this calculation. Among other things, it eliminated personal exemptions and sharply raised the standard deduction. With inflation adjustments, every married couple will get a $30,000 deduction in 2025 without needing to itemize. Median household income is around $80,000. This means paying mortgage interest or property taxes brings no additional tax benefit for most families.
Very few middle-class households have enough mortgage interest and other deductions to justify itemizing. They get the same deduction whether they rent or buy. We have thus removed what was once an important subsidy to homeownership. Maybe that’s the right policy but it’s changing the housing market.
We will see what new equilibrium emerges, but I expect renting your home will become far more common than it used to be, and homeownership less so—especially for the lower 80%–90% of the income scale. That process is already underway and is one reason rental demand is so strong in most of the country. We don’t have enough affordable homes to meet demand, and the construction that’s happening tends to be larger homes than middle-class families can handle.
Gary Halbert, used to say, “the solution to high prices is high prices.”
That cycle unfolds over months in agriculture. Housing is different because houses take longer to build, and also because we “consume” them slowly over decades. But the law of supply and demand does eventually work unless external forces prevent it.
That’s where we are now: high demand, low supply. The shortage is not uniform across the country, though. Some rural areas have excess housing because jobs are so scarce. Meanwhile, stylish urban cores have plenty of housing if you are a wealthy executive or highly-paid professional. Regular people have no chance of living there, even as the well-heeled residents generate all kinds of demand for service workers. Those workers end up commuting from suburbs and exurbs, which in many places are also filling up, forcing new residents further and further out.
The obvious answer is to build more lower-end housing closer to the places that need workers. That is proving extremely difficult, often due to NIMBY (“Not in My Back Yard”) sentiment among current residents. They like where they live, they don’t want it to change, and they can afford the inconveniences their resistance generates.
The problem is that building codes and land-use regulations are blunt instruments. The National Association of Homebuilders estimates that regulations and government mandates add almost $94,000 to the cost of a new single-family home. This is on top of higher materials costs. The same study shows rising softwood lumber prices over the last 12 months have added $35,872 to the price of an average new single-family home and $12,966 to the market value of an average new multifamily home. That increase in multifamily value means that households pay $119 a month more to rent a new apartment.
Skilled construction labor is scarce and becoming more so. The laborers have the same problems, too. Where are they supposed to live? Every extra hour they spend commuting is an hour that further delays progress.
Markets:
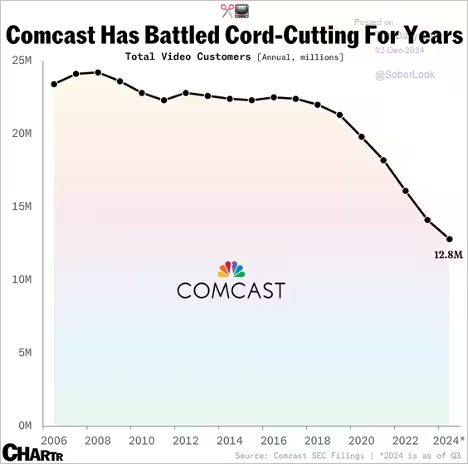
Comcast struggles with declining video customer base amid cord-cutting trend.
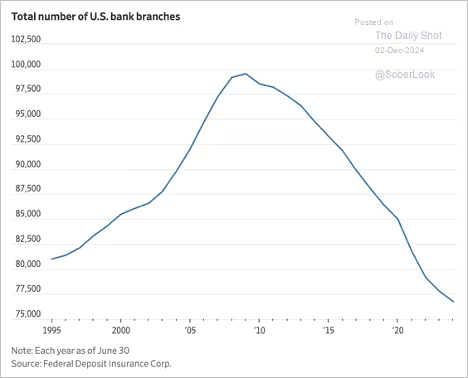
US bank branches:
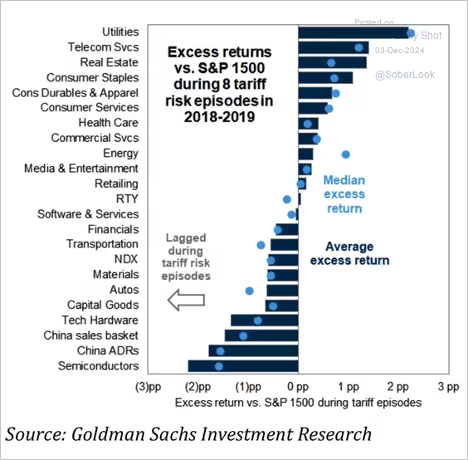
This chart shows tariff exposure by sector.
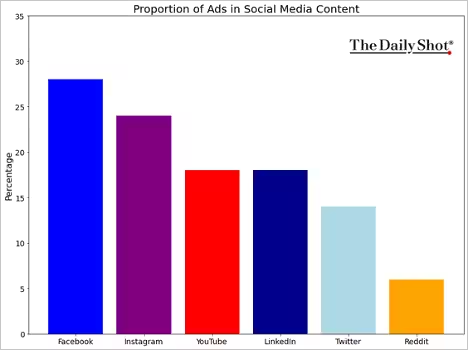
Ad content as a share of social media platforms:
Client assets held by major US banks in Q3:

Source: @wealth Read full article
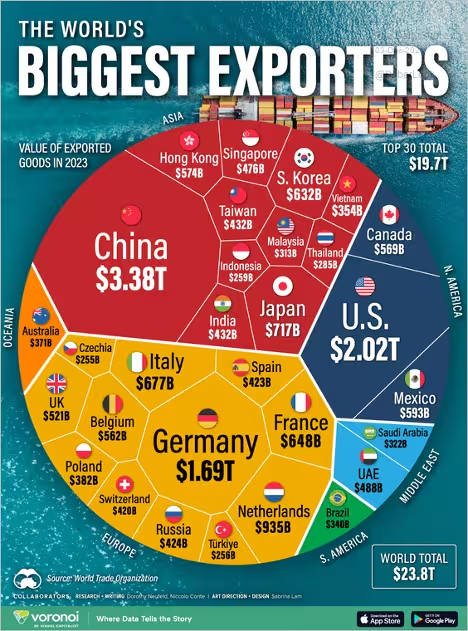
The biggest exporters:
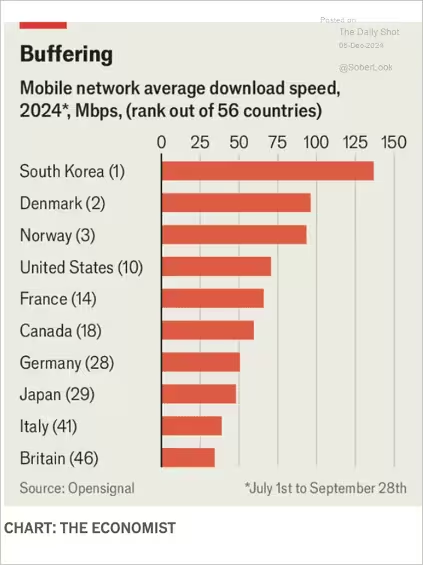
Mobile network speeds by country:
Economy:
With Thanksgiving behind us, the holiday-shopping season has officially begun. And while we’re still early in the season, Americans are spending more than ever for the time of year.
E-commerce platform Shopify (SHOP) said that it saw a 22% increase in sales on Thanksgiving. And credit-card company Mastercard (MA) said that online shopping is already up 15% from last year – even higher than last year’s 9% growth.
In total, Thanksgiving Day spending jumped 9% from last year to a record $6.1 billion. Then on Black Friday, it surged above $10 billion.
That wasn’t the peak…
On Cyber Monday, folks spent another $13 billion – marking the biggest online-shopping day ever. According to Adobe Analytics, folks spent the most on Bluetooth headphones, TVs, and other electronics.
Consumer spending growth slowed in October, dragging the Atlanta Fed’s GDPNow Q4 growth estimate lower.
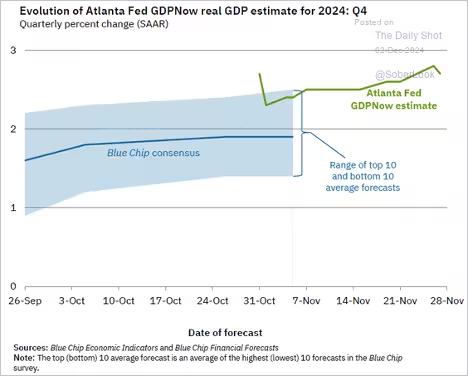
Spending on non-durable goods declined. Real incomes improved. Slower spending combined with rising incomes led to an increase in savings. The PCE inflation report showed faster price gains in October. US financial conditions eased last week as the dollar and Treasury yields retreated. Durable goods orders saw minimal growth in October, surprising to the downside, while capital goods orders unexpectedly fell.
A record number of Americans traveled by air on Thanksgiving.
Job openings in October exceeded expectations, accompanied by a sharp rise in quits (voluntary resignations), signaling a robust labor market. US economic sentiment keeps rising.
Economists have been lowering their 2025 forecasts for housing starts and existing home sales, due to expectations of persistently high interest rates.
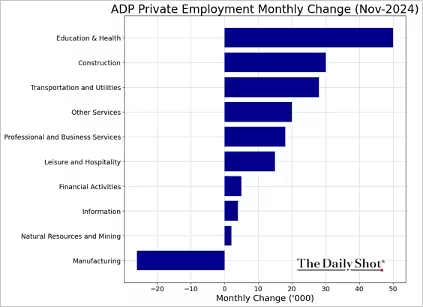
The November ADP employment report was roughly in line with expectations. Key sectors posted payroll gains, except for manufacturing, …
Small businesses have not done much hiring this year. CFO optimism has been rebounding. Economists have been reducing their estimates of US recession probabilities. US productivity growth remains above its pre-COVID trend, significantly outpacing that of other G7 economies.
The Fed
“The U.S. economy is in remarkably good shape,” Powell said, referencing the most recent data about GDP (running near 3% annualized) and unemployment (4.1%). And while noting that the Fed’s preferred inflation measure (2.8%) has been “a little higher,” Powell spun that as a positive regarding potential Fed policy moving ahead.
“We can afford to be a little bit more cautious as we find neutral,” Powell said, referring to a federal-funds rate that is neither too stimulative nor too restrictive. He said the Fed’s goal is to get to a “less restrictive level over time” and that the central bank’s 50-basis-point first cut in September was meant to be a signal the Fed was ready to support the labor market.
Leading into that decision several months ago, the unemployment rate had risen by nearly a full percentage point from 3.5% in the summer of 2023 to 4.3% this July. But in the months since then, the labor market has shown signs of strengthening, if anything.
“The economy is strong, and it’s stronger than we thought it was going to be in September,” Powell said today.
So, now, the Fed chair is saying that larger rate cuts aren’t quite needed, but that the Fed still wants to take some pressure off the economy. Translation: Expect another rate cut at the Fed’s next meeting, but likely of the more typical 25-basis-point variety like the central bank did last time around on November 1.
This was Powell’s last public speaking appearance before Fed members go into a media “blackout” ahead of their next policy meeting on December 17 and 18. So, it was the final time he could publicly relay signals to investors about what to expect from the Fed.
What we heard today was essentially the status quo. The central bank is still on a path to whatever it considers a neutral fed-funds rate – which isn’t quite known with certainty, but which Fed members appear to believe is lower than the current range of 4.5% to 4.75%.
Friday’s “nonfarm payrolls” report, which brings an updated unemployment rate, could also play a role in the Fed’s calculus, especially if it illustrates a stronger-than-expected labor force.
US payrolls grew 227,000 in November and the two prior months were revised up by a combined 56,000. The bond market’s immediate reaction was to raise odds of a December rate cut from 70% yesterday to now 89%. Longer-term yields were little changed, though, suggesting the report had a limited effect on inflation expectations.
Great Quotes
“Tell me and I forget. Teach me and I remember. Involve me and I learn.” – Ben Franklin
Picture of the Week

All content is the opinion of Brian Decker


