Powell again reiterated what he said in December, that the Fed believes its policy rate is “likely at its peak for this tightening cycle.” That’s music to many investors’ ears.
But he also couched that statement by not putting a timetable on anything. Powell said…
If the economy evolves broadly as expected, it will likely be appropriate to begin dialing back policy restraint at some point this year. But the economic outlook is uncertain, and ongoing progress toward our 2% inflation objective is not assured.
Reducing policy restraint too soon or too much could result in a reversal of progress we have seen in inflation and ultimately require even tighter policy to get inflation back to 2%. At the same time, reducing policy restraint too late or too little could unduly weaken economic activity and employment.
In the end, he said the Fed will keep looking at data and repeated what he said after the central bank’s last policy meeting in January: The Fed is looking for greater “confidence” that the pace of inflation is en route to a 2% annual rate (with more monthly numbers that suggest so) before it lowers its benchmark bank-lending rate.
Powell said in response to a question from McHenry…
We have some confidence in that… We want to see a little bit more data.
Hopefully, if you’ve been following along with us since December, none of this comes as a surprise. We’ve been saying that rate cuts weren’t likely to happen as quickly and at such a scale that it appeared many investors were anticipating. That’s in part because of “sticky” high housing prices and a surge in freight costs associated with the war in the Middle East.
The thing is, now the market has appeared to have come around to this idea in the past few months, signaled by bond yields rising since December. And investors also appeared to take Powell’s testimony in stride today. The major U.S. indexes rose. The benchmark S&P 500 was 0.5% higher… And yields fell slightly across most durations today, meaning bond prices were up as well.
The latest PCE inflation data came out stronger than expected, showing a 2.4% rate for the 12 months through January, or 2.8% for the Core PCE index, which excludes food and energy. The latter is the Fed’s benchmark and is getting closer to their 2% target.
Taken as a whole, Core PCE is running about 80 basis points above target. Housing prices alone explain all of that “excess” inflation plus a little more. Medical and food services (i.e., restaurant prices) are the next biggest contributors. In theory, price weakness in some combination of those sectors could put Core PCE inflation at 2% soon, assuming everything else held steady. Then what? No one knows. Fed officials have said they want to see sustainable 2% inflation, which implies it needs to stay at that level for some period of time. The next year or so may tell us what that means.
Here’s a good illustration of how inflation hits the economy not all at once but in waves as different prices rise and fall. The dashed line is Consumer Price Index inflation from 2020 to now. You can pick out the 2021/2022 acceleration if you look closely, but otherwise the line is remarkably steady.
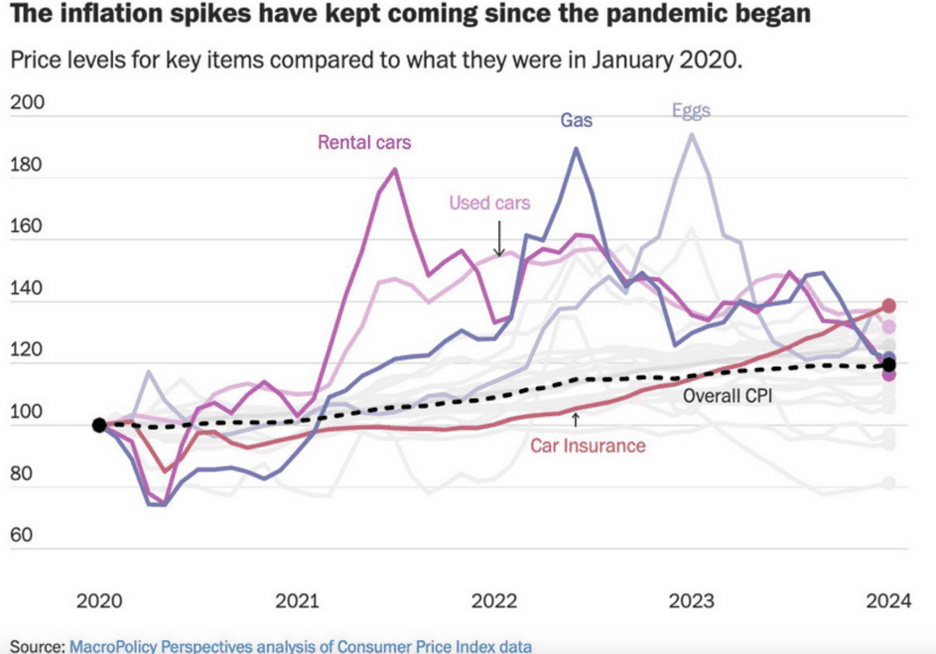
The other lines aren’t steady at all. Rental car, used-car, gasoline, and egg prices all had sharp but short-lived increases, based on their own particular supply and demand factors. Car insurance was an exception to that rule, rising much faster than CPI over the period, but at a much steadier pace. This matters to inflation perceptions. At any given point in time, something is probably getting more expensive. People notice it and think inflation in general must be accordingly worse. Even if that’s not true, the perception lingers.
This is a 10-year look at inflation, broken down by spending categories. Start at the bottom. Electronic items and clothing prices were all flat or down. Other kinds of tangible goods—cars, furniture, food—rose somewhat more. Food rose quite a bit more, but this category includes both groceries and restaurant meals. So it’s partly a service, too.
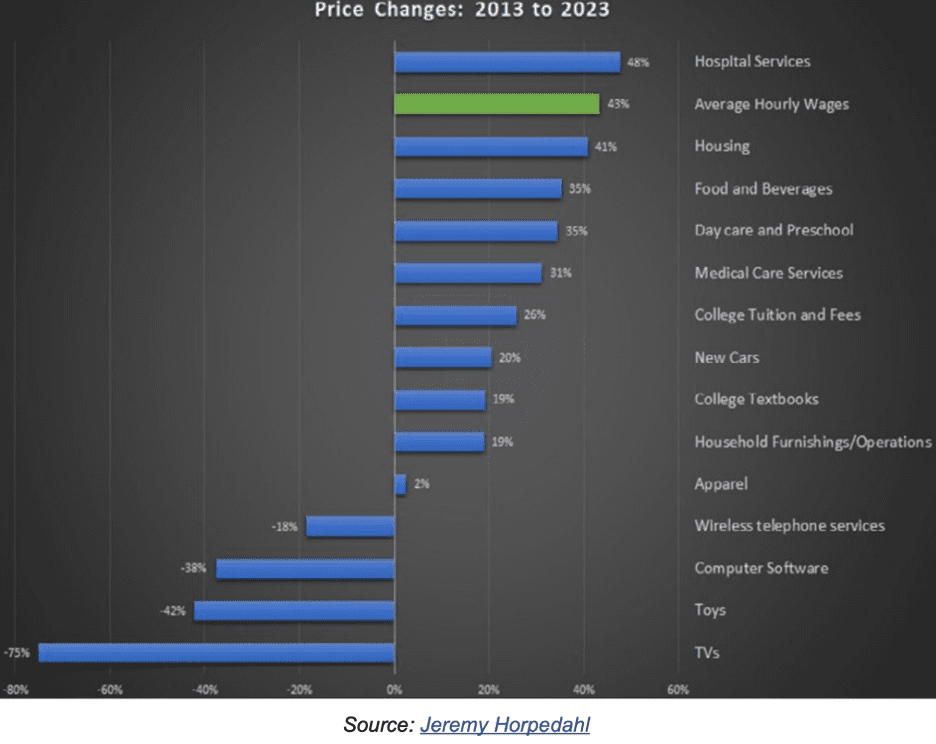
The biggest price increases were in hospital services and housing. The hospital part isn’t as noticeable because most people don’t need it. But the most interesting part is that green bar showing average hourly wages. Over a decade, they actually kept up or rose faster than all these expense categories. In percentage terms, wages rose more than housing, food, cars, and even college education. Most of this occurred in the last three years. And with the labor shortage set to persist, it may continue.
US Economy
- The ISM manufacturing PMI unexpectedly moved deeper into contraction territory last month, dragged lower by inventories and employment.
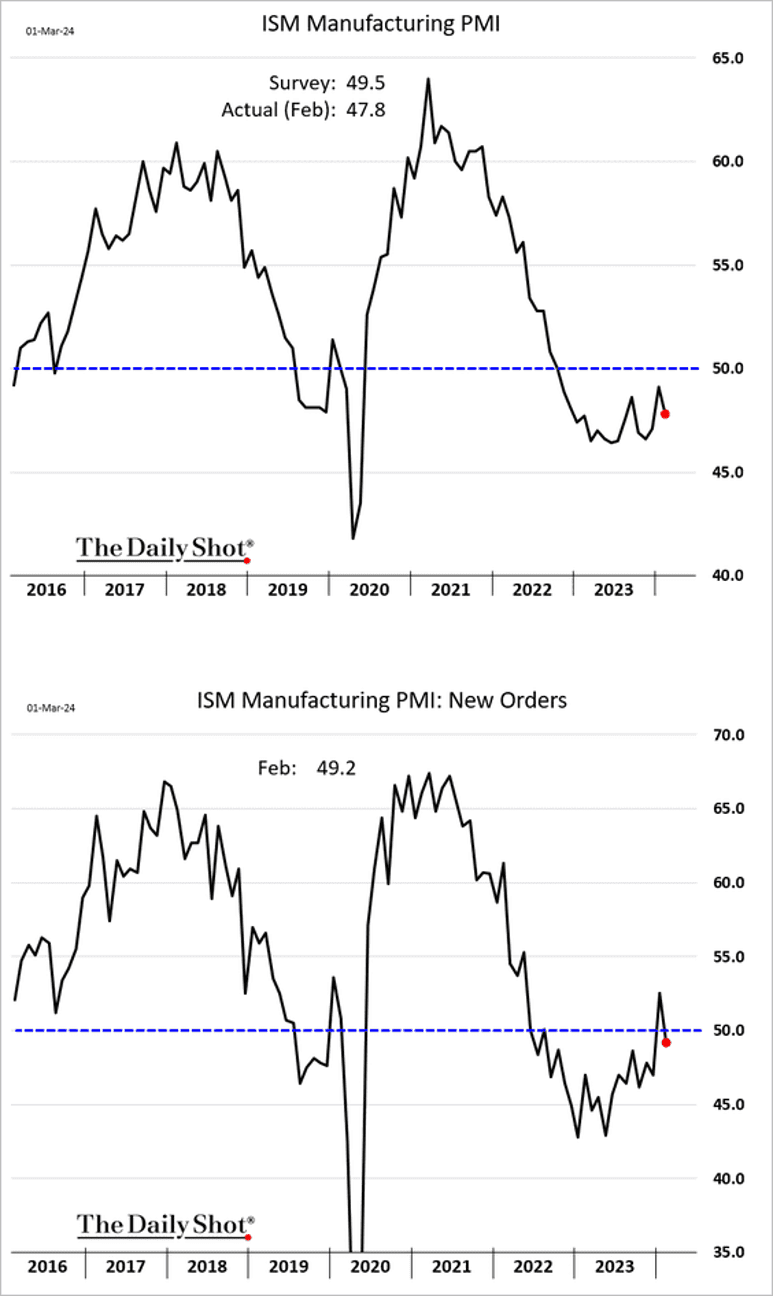
- The ISM data tends to concentrate on larger multinationals, while S&P Global surveys encompass a more representative mix of companies across various sizes.Amid slower growth in China and Europe, multinationals are encountering more obstacles compared to domestic industrial companies. Shares of small- and mid-cap industrials have outpaced both their benchmarks and larger-cap counterparts. The ISM manufacturing PMI weakness, therefore, is not representative of the broader US economic activity.
- Moreover, leading indicators continue to signal stronger US manufacturing activity.
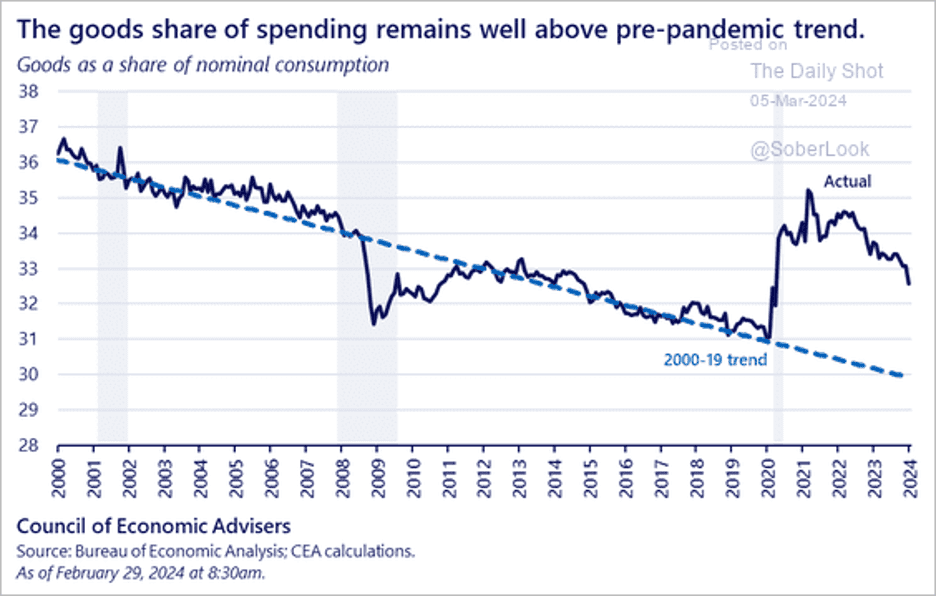
- Goods spending remains elevated relative to services.
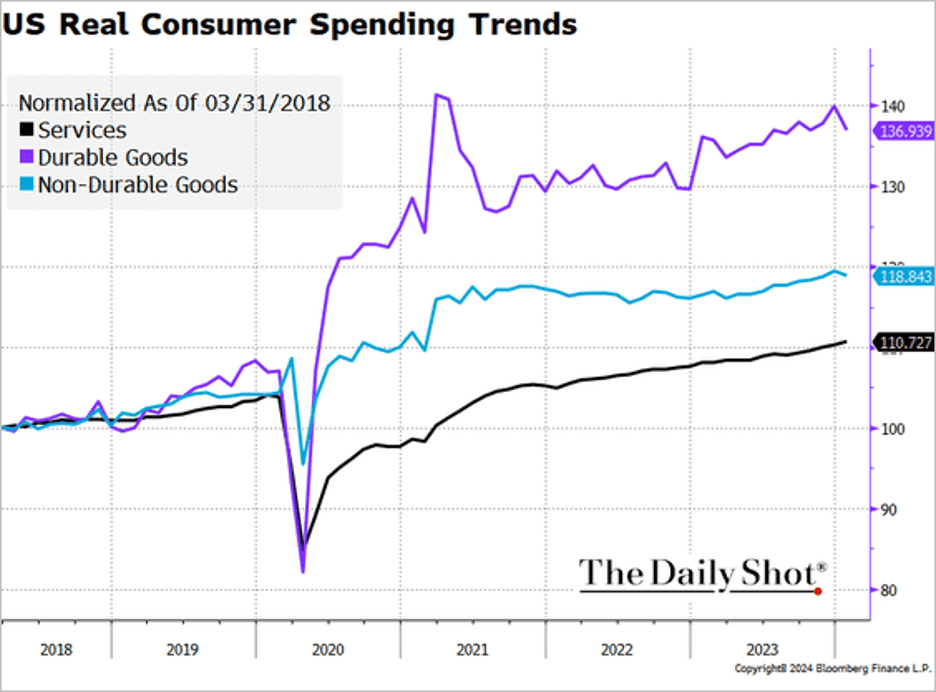
Source: @TheTerminal, Bloomberg Finance L.P.
Here is the goods share of total spending compared to the pre-COVID trend.
Source: @WhiteHouseCEA
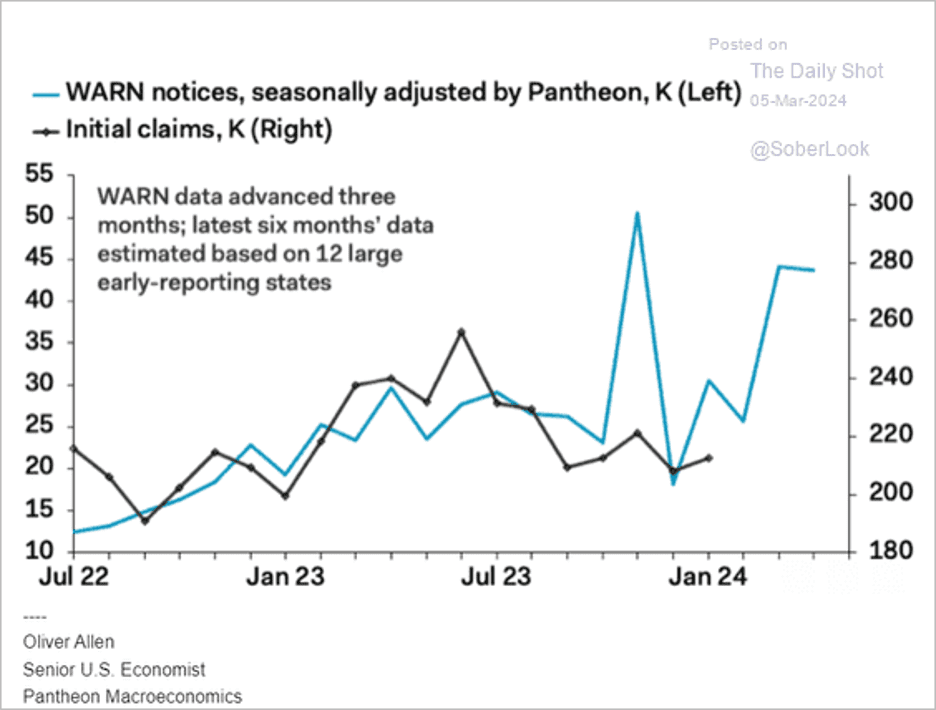
- WARN notices continue to signal higher unemployment claims ahead.
Source: Pantheon Macroeconomics
- The ISM Services PMI eased in February, signifying a deceleration in growth.
- The employment component drove the ISM PMI decline, dipping into contraction mode.
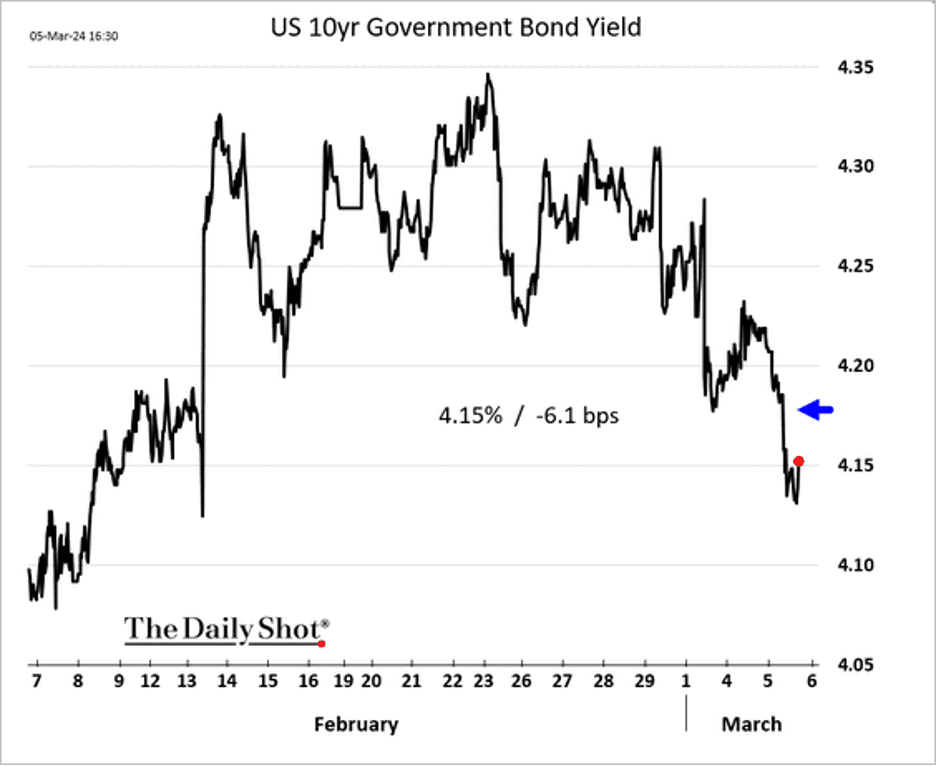
- Treasury yields fell in response to the ISM Services report, notably due to the employment and cost components.
- However, the new orders index surprised to the upside.
- The orders-inventories spread points to stronger service-sector activity ahead.
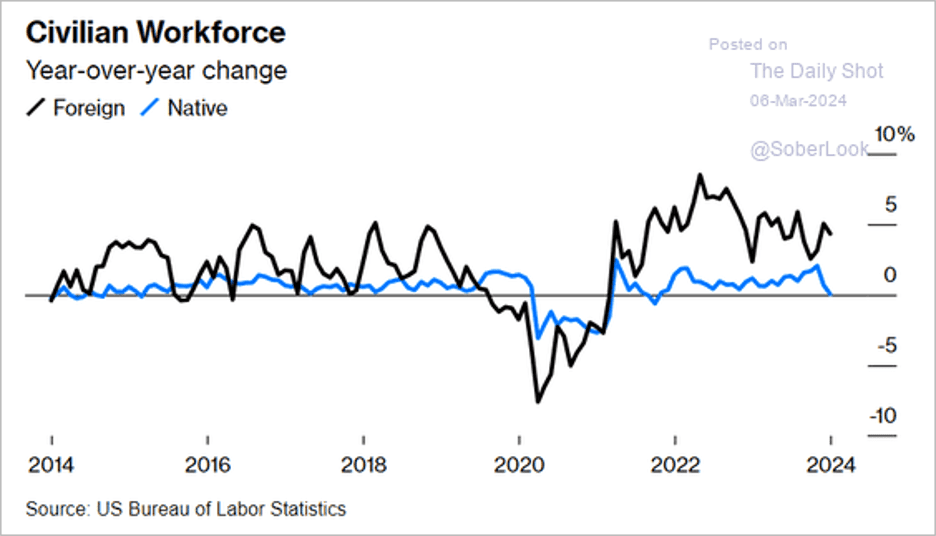
- Companies are increasingly reliant on foreign-born workers to meet their staffing needs.
- The ADP private payrolls estimate showed 140k jobs created in February, which was slightly below expectations. Job creation in healthcare, a key contributor to US employment in recent years, saw its smallest increase in two years. Job openings in retail, logistics, and government sectors, particularly among public school teachers, were factors that negatively impacted the overall job openings tally. The labor market is still tight.
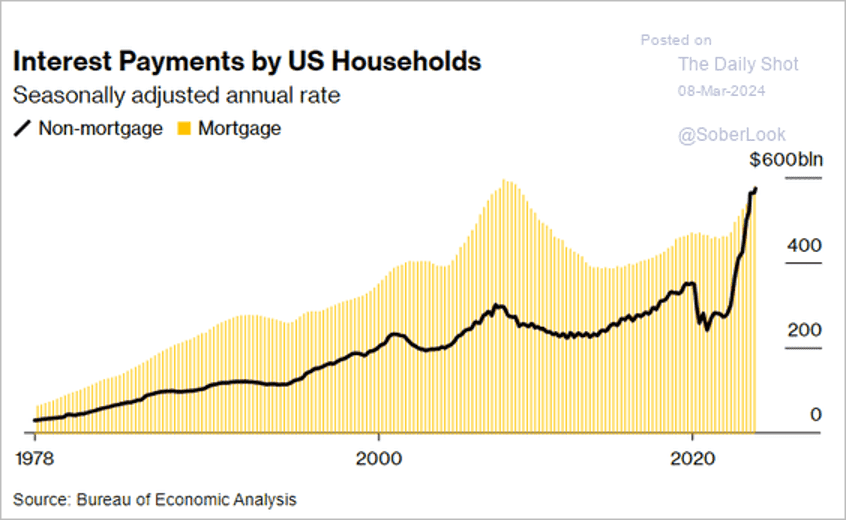
- Americans now incur as much interest on consumer debt as they do on mortgage loans.
Market Data
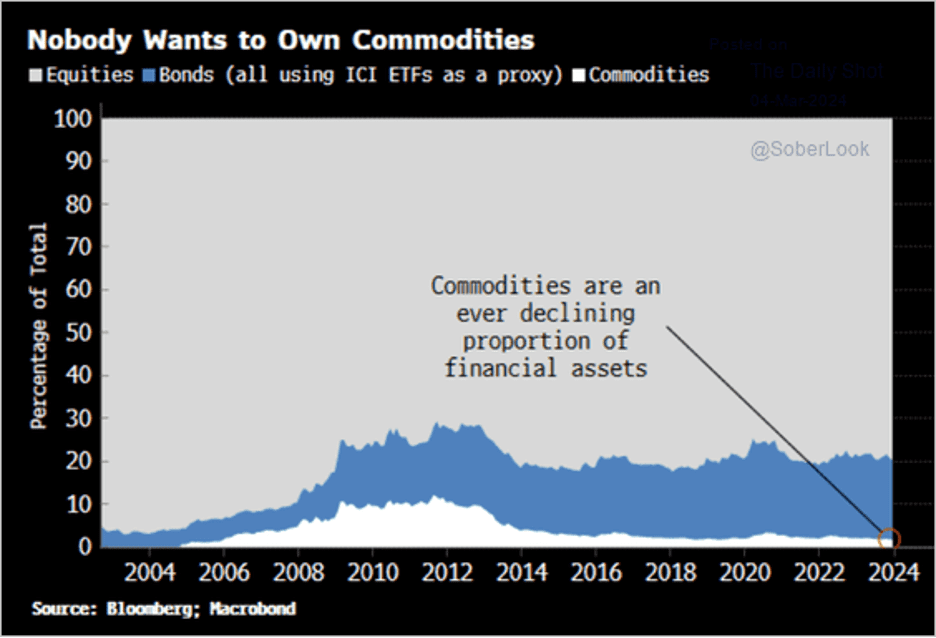
- Allocations to commodities have been depressed over the past decade.
Source: Simon White, Bloomberg Markets Live Blog
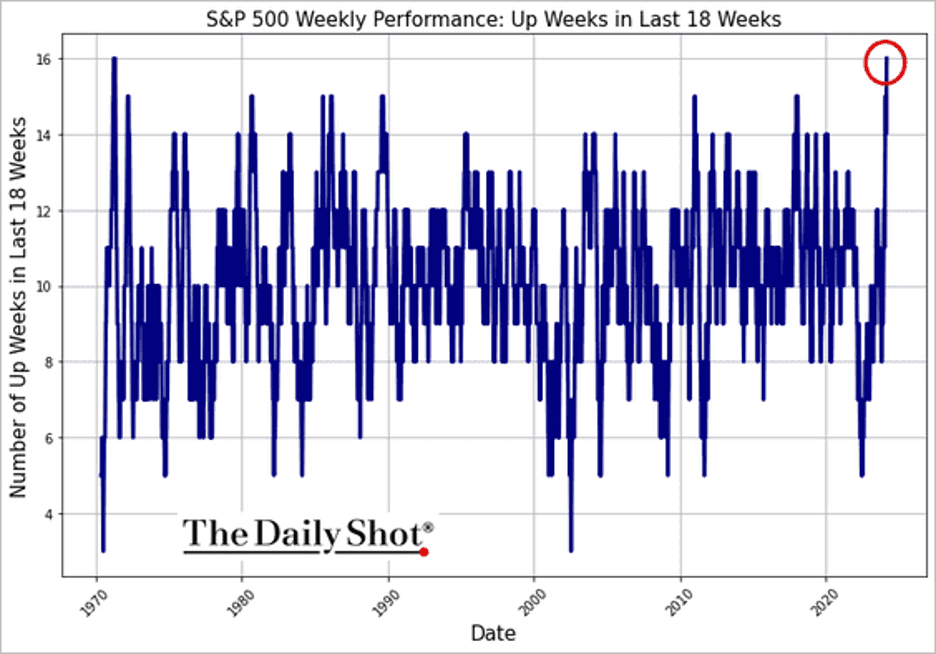
- It’s been over half a century since the S&P 500 was up 16 out of 18 weeks.
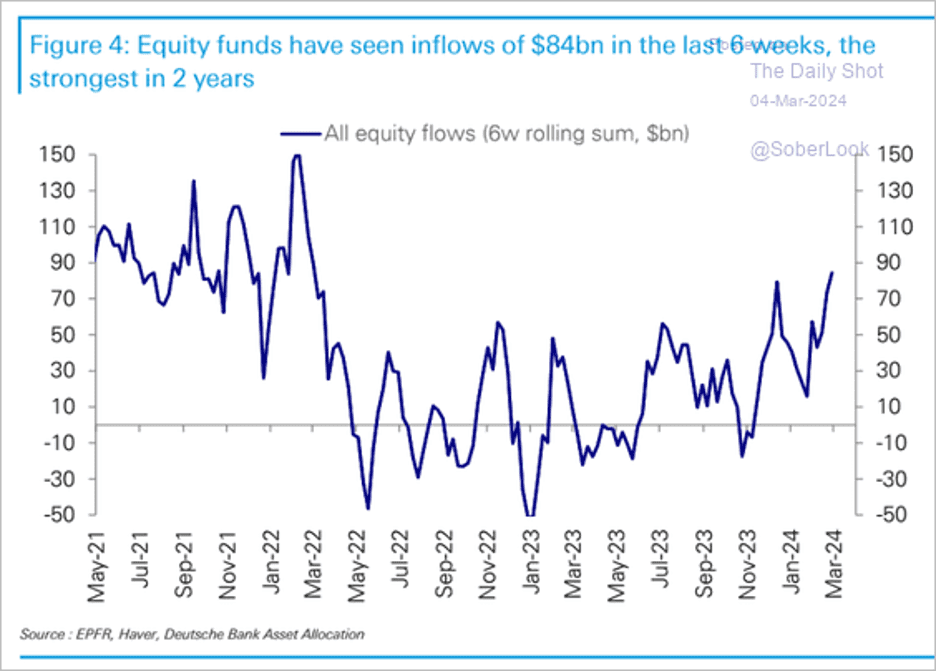
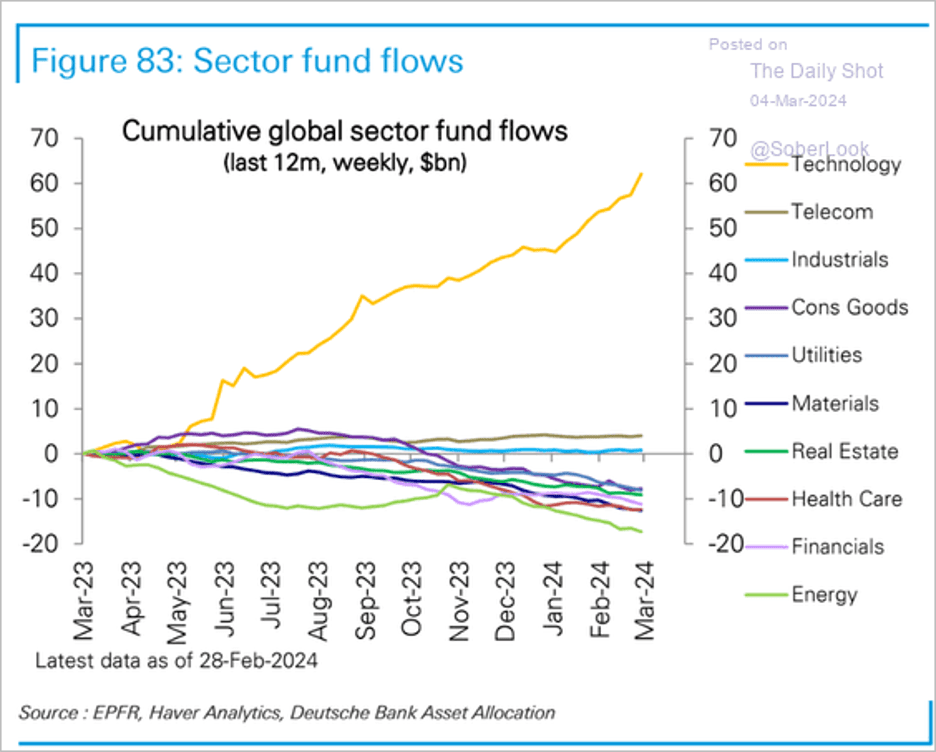
- Fund inflows remain robust, …
Source: Deutsche Bank Research
- … with flows into tech funds reaching extreme levels.
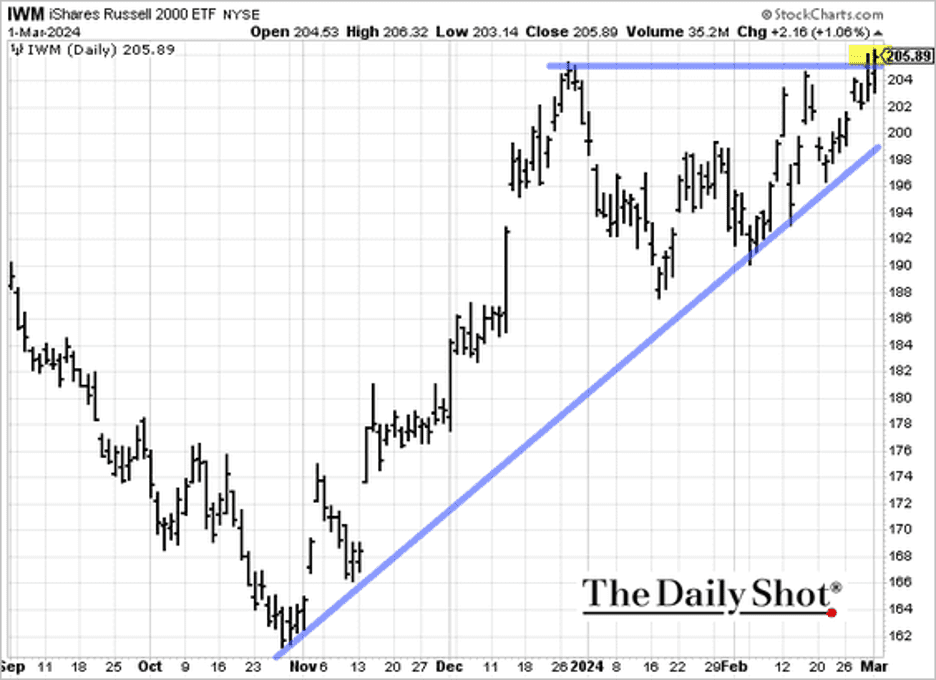
- Will we see a breakout in the Russell 2000 index?
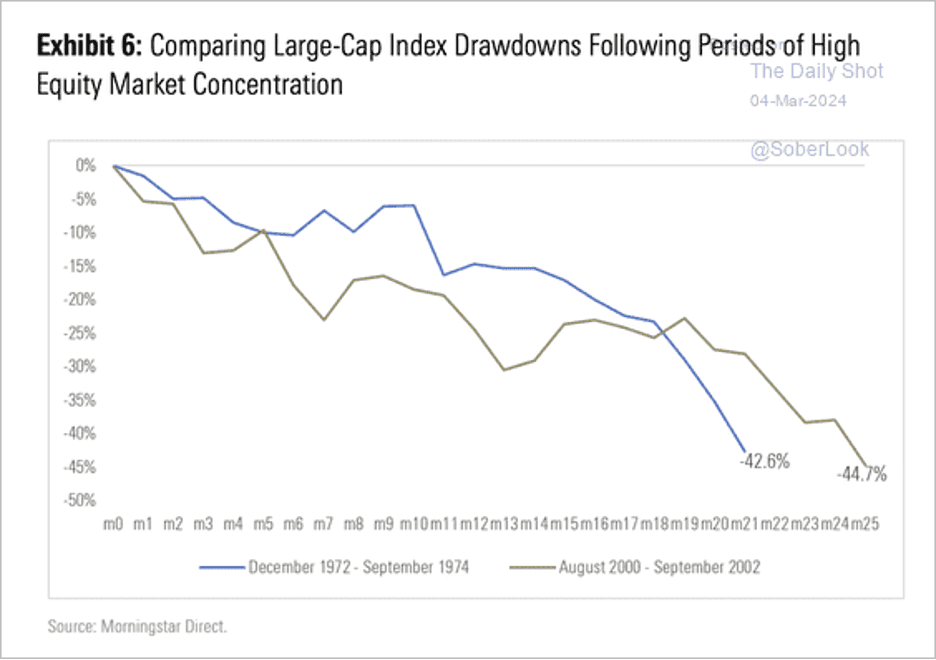
- Prior periods of extreme market concentration have preceded significant drawdowns.
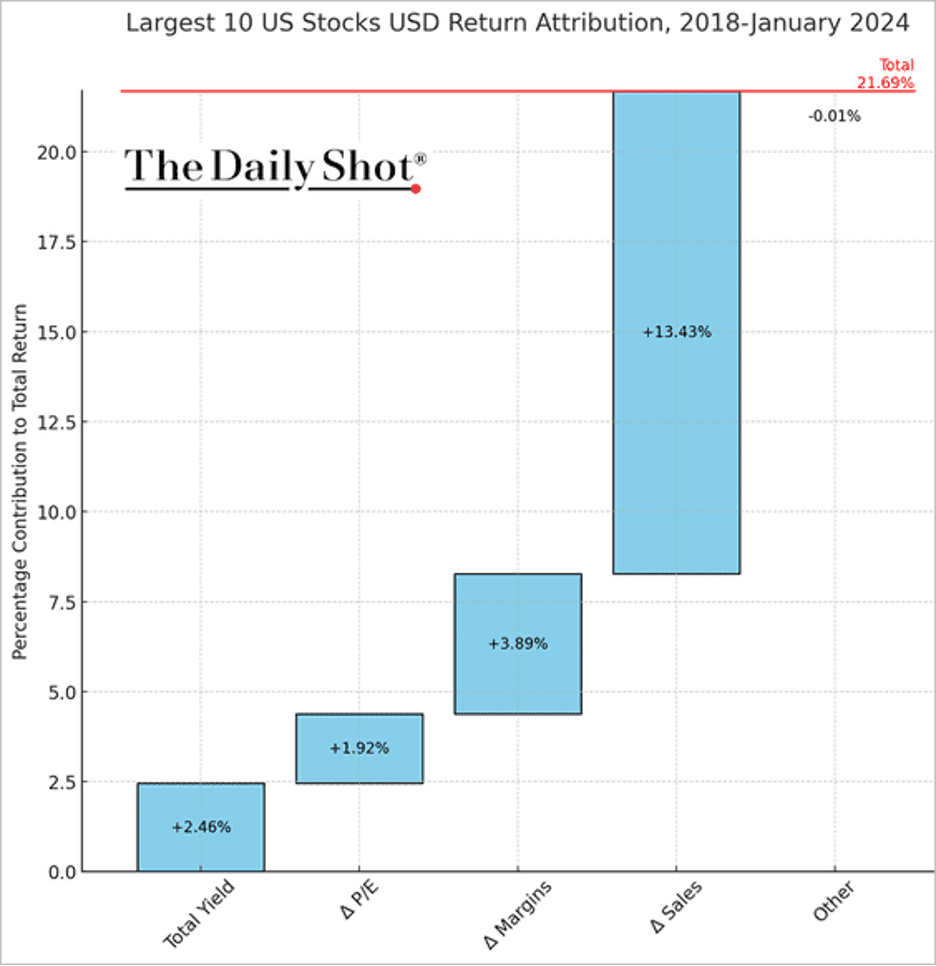
- Rising sales have been the largest contributor to returns among the top 10 US companies by market cap over the past six years.
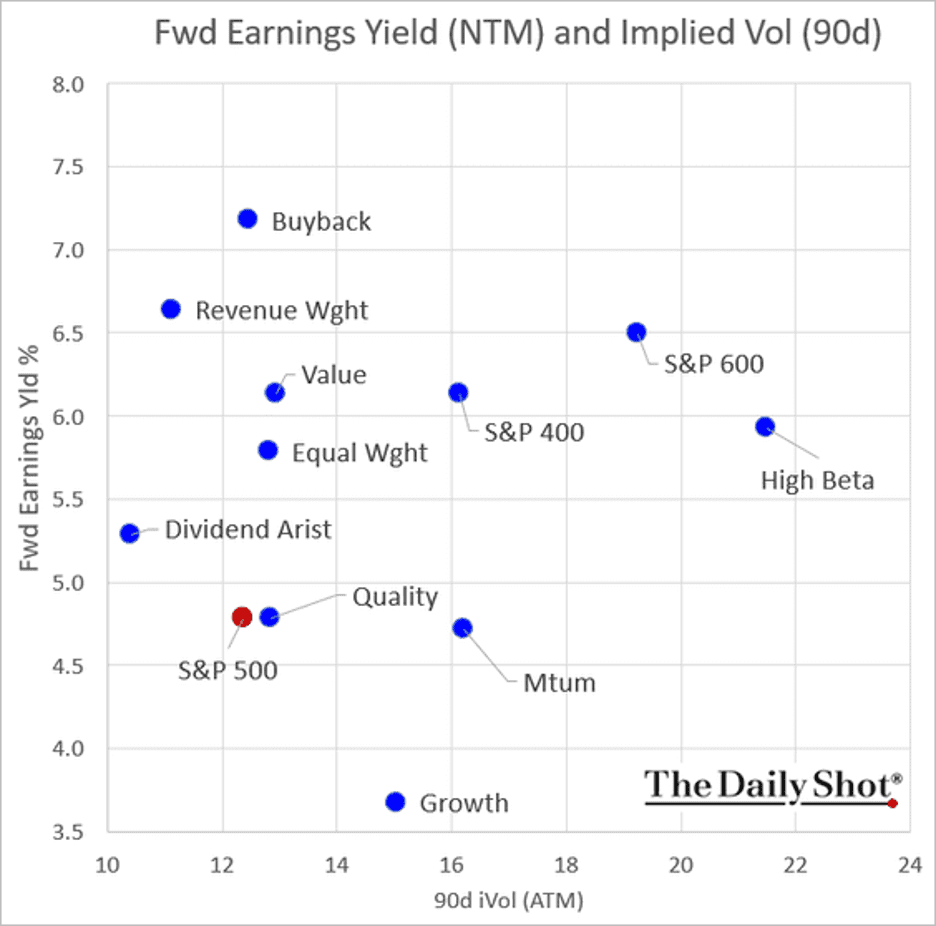
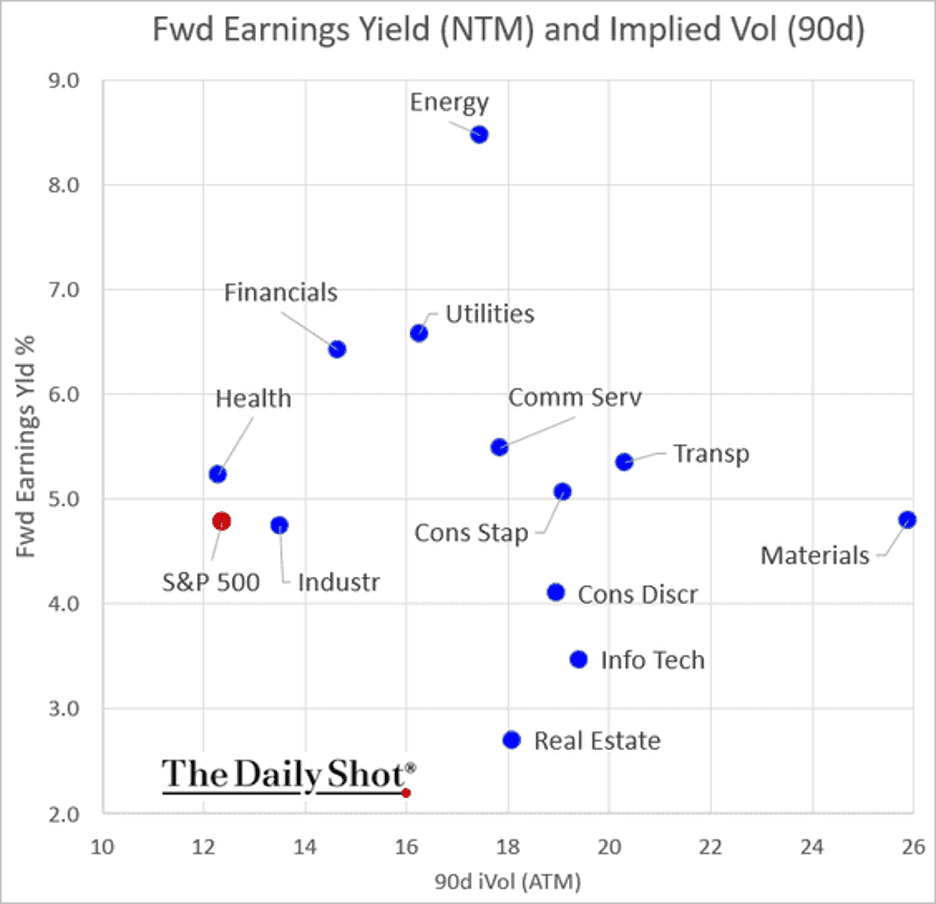
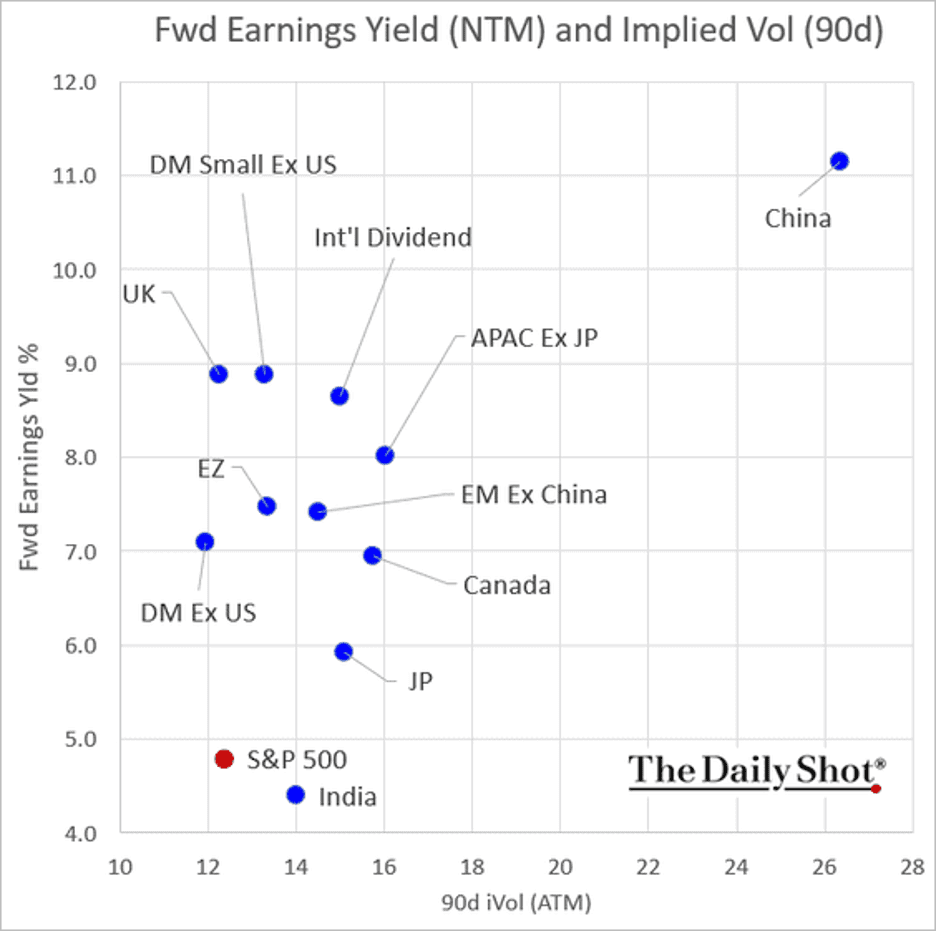
- Next, let’s take a look at consensus earnings yields and implied volatility (projected performance vs. perceived risk).
- Factors:
- Sectors:
- International:
- The semiconductor cycle is improving after contracting over the past two years.
![]()
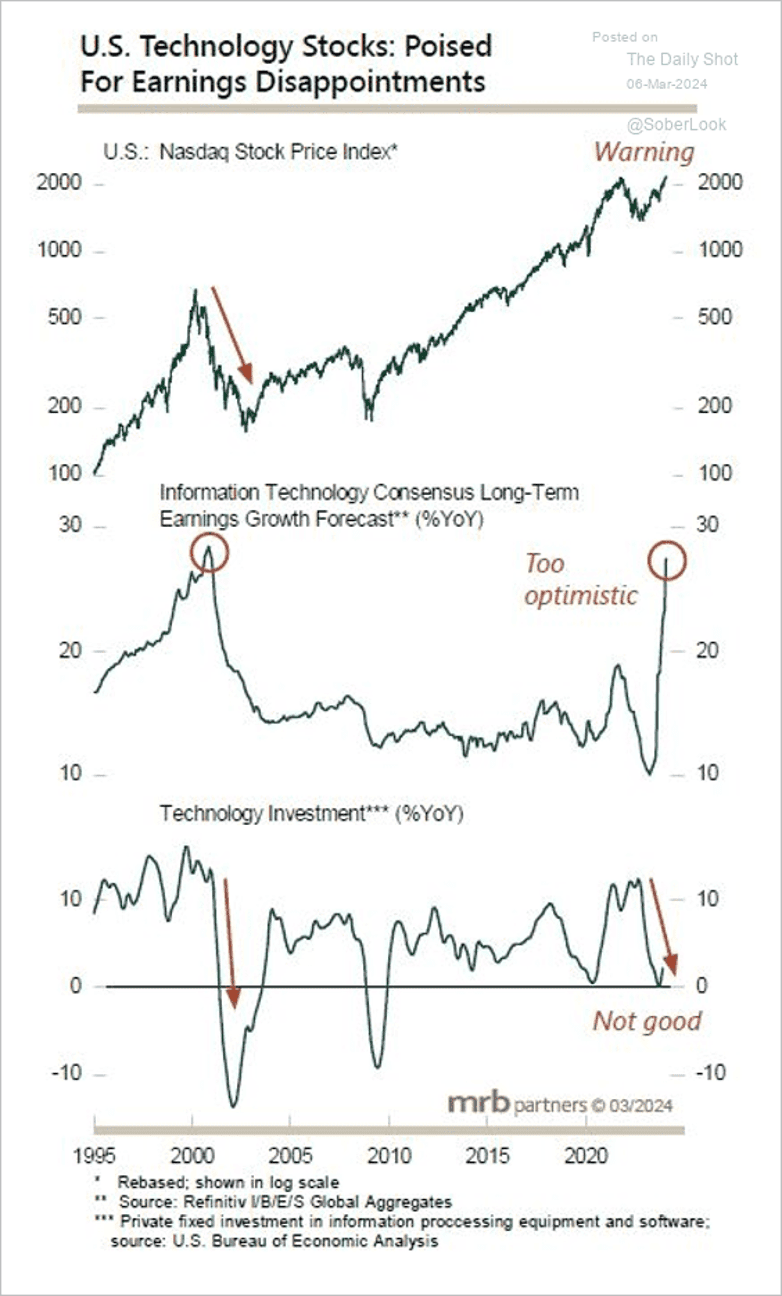
- Analysts are very optimistic about US tech sector earnings growth.
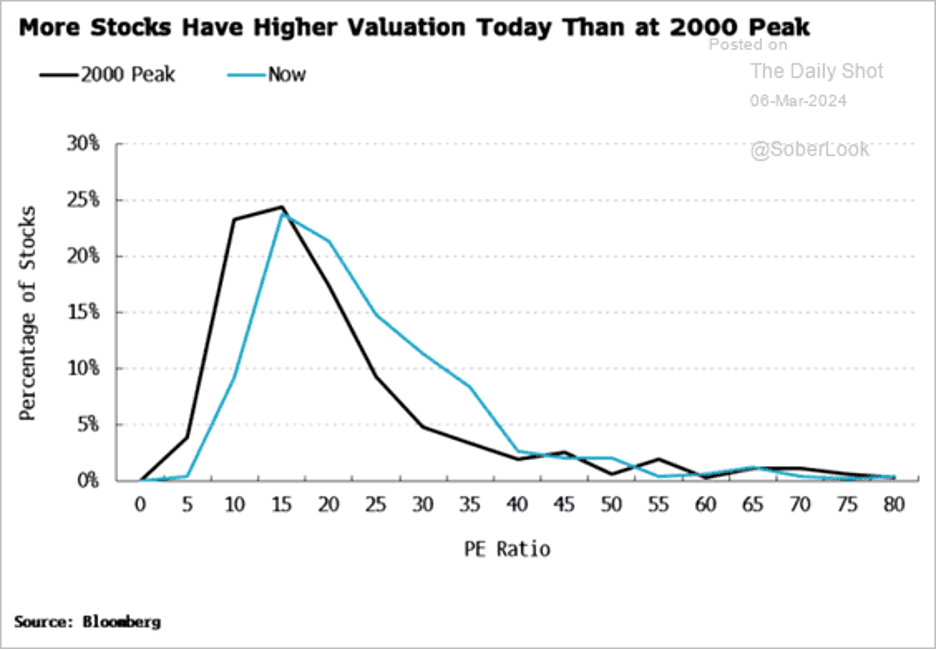
- This chart shows the distribution of S&P 500 P/E ratios now and at the dot-com peak.
Great Quotes
“I know you think you understand what you thought I said but I’m not sure you realize that what you heard is not what I meant.” – Alan Greenspan
Picture of the Week
Leopard, Kruger Park South Africa

All content is the opinion of Brian Decker


