

The market continues to scale back Fed rate cut expectations, with a 50 bps rate cut in November now off the table. Mortgage rates jumped back to 7% since the blowout US employment report.
The market is a bit queasy about the US government’s efforts to break up Google.
Analysts expect a slowdown in earnings growth in Q3.
What will drive U.S. equity returns over the next month? This chart shows survey results from S&P Global.
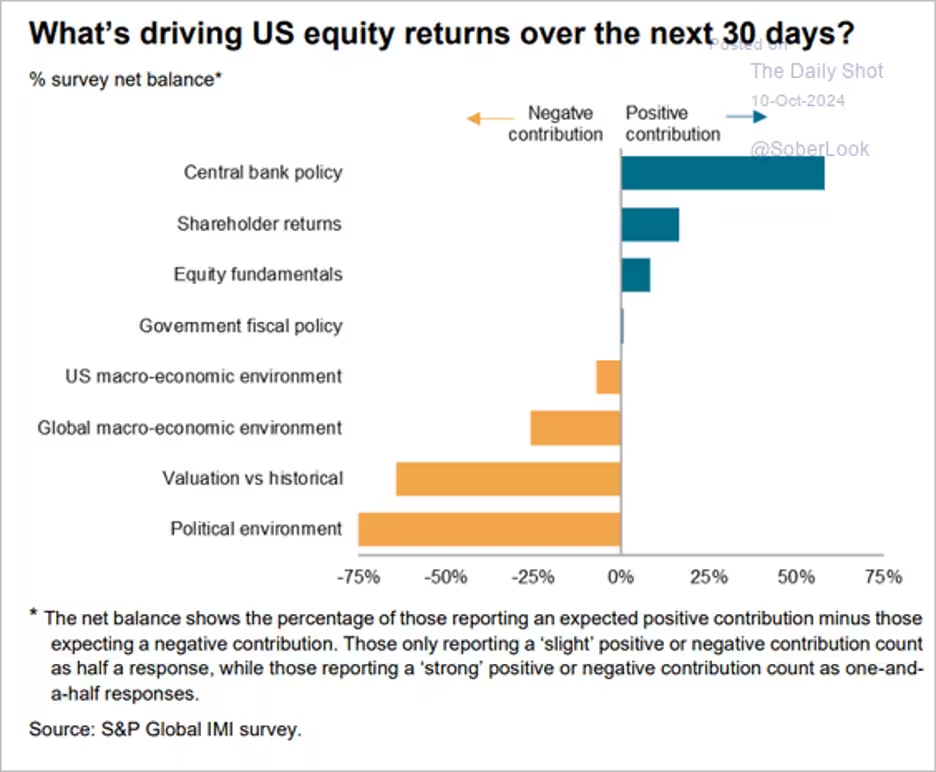
Source: S&P Global PMI
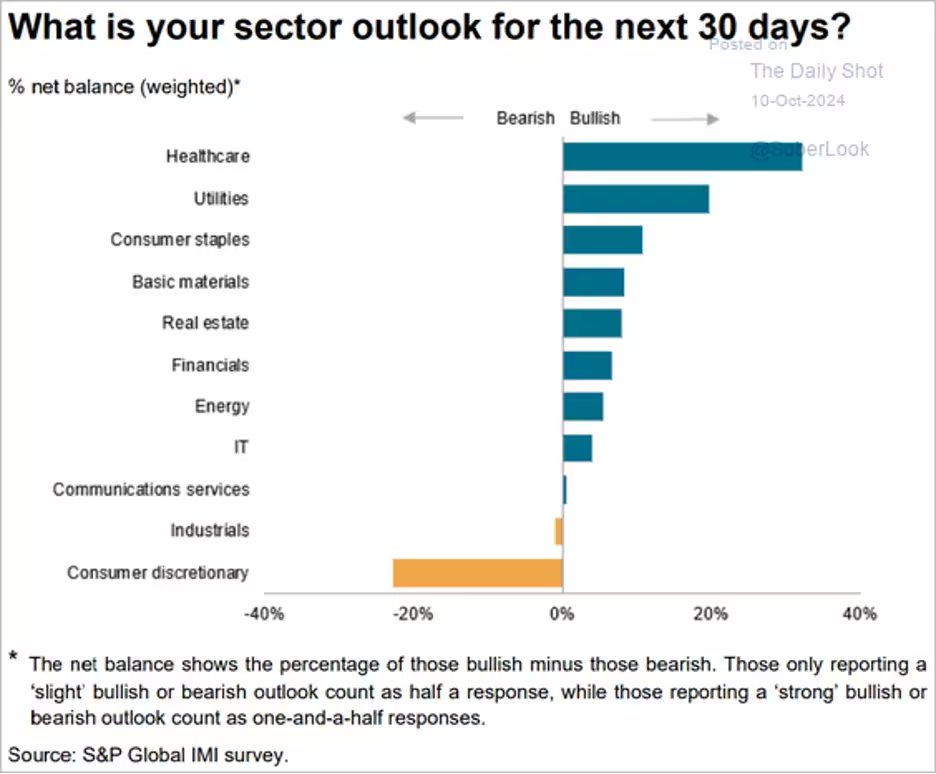
How do institutional investors view the performance of various sectors over the next 30 days?
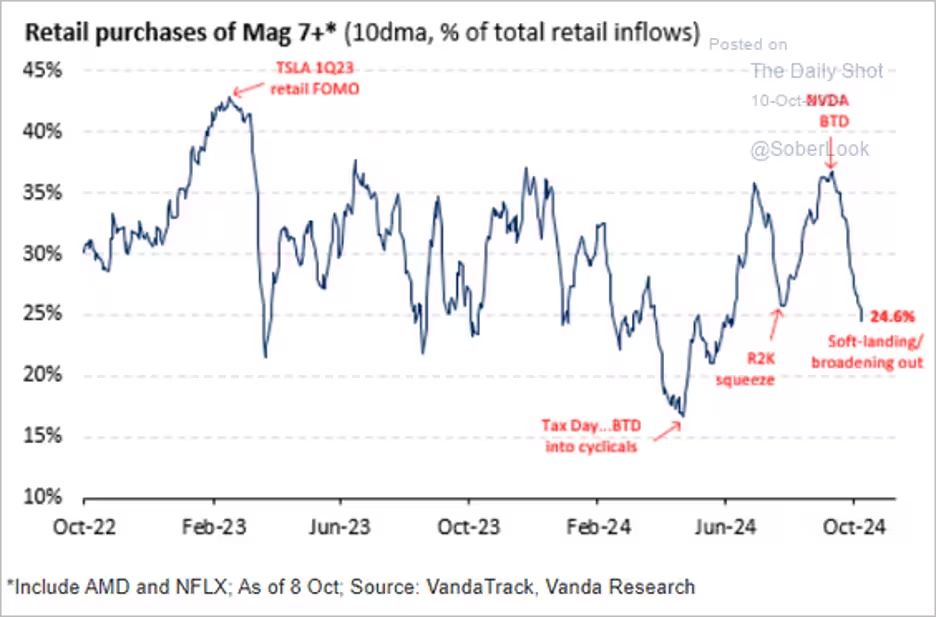
Retail investors have been scaling back their purchases of individual stocks. Purchases of tech megacaps have been trending lower.
Economy:
September job gains exceeded expectations, indicating that US economic activity remains strong. The unemployment rate declined to 4.1%. As a note of caution, the job survey response rate was very low, and the seasonal adjustment factor was elevated, indicating a potential for a downward revision. Improved productivity is boosting US potential GDP growth. The NFIB small business sentiment index edged higher in September, but the uncertainty index hit a record high ahead of the elections. The Atlanta Fed’s GDPNow estimate for Q3 GDP growth is above 3% (annualized).
This week, CMG’s Brian Schriener shared the next chart plotting three recession indicators, including the yield curve inversion, unemployment rise, and leading economic index drawdown. It looks at recessions and soft landings since 1949, showing how many indicators were triggered during each one. As the chart shows, recessions occurred every time two or three of the recession indicators were triggered. The current reading is 3.
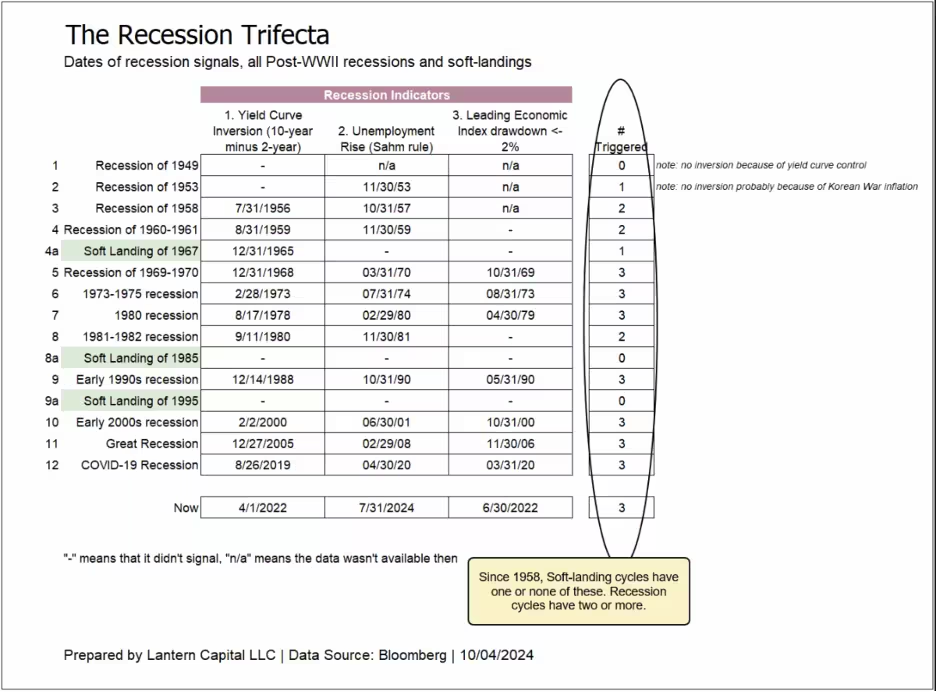
Source: Lantern Capital LLC, Bloomberg
The Fed:
Since the Fed’s 50 bps cut, the 10-year Treasury yield has gone from 3.6% to 4.1%—up, not down. Looking at this week’s CPI and PPI reports, it seems early for the Fed to claim victory over inflation. The betting markets still favor two more 25 bps rate cuts this year and more in 2025. We need to monitor the 10-year Treasury yield and inflation data. Right now, both are trending higher. The Fed’s next meeting is November 6 and 7, so we’ll learn more then.
It is unusual to see a strong payrolls report as the Fed starts easing rates. The market scaled back rate cut expectations for the coming months, with the probability of jumbo rate cuts sharply declining. The market is pricing in an additional 56 bps of rate cuts this year. Economists expect 50 bps. Treasury yields surged. The yield curve flattened. The US dollar jumped. Stocks were higher.
The inflation report came in stronger than anticipated, with core CPI accelerating in September. However, Fed officials didn’t seem particularly concerned.
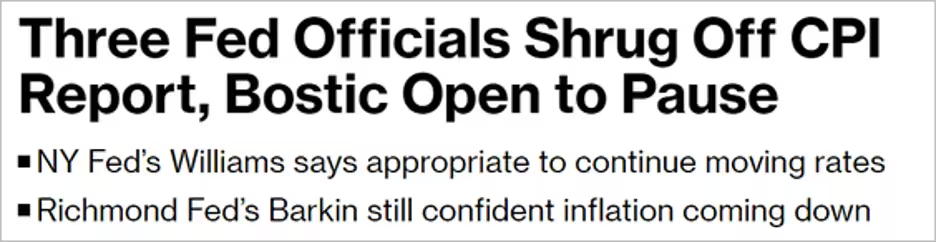
Source: @economics Read full article
The components of the CPI that saw substantial increases have no impact on the core PCE, the Fed’s preferred measure.
Pantheon Macroeconomics: – The pick-up in the core CPI in September was driven by components that are often volatile and do not influence the core PCE deflator. Both airline fares, which leapt by 3.2% and contributed 0.03pp to the increase in the core CPI, and auto insurance prices, which rose 1.2% and contributed 0.04pp, will not feed into the core PCE calculation, as PPI data are used instead.
The core goods CPI increased for the first time in seven months, boosted by apparel prices.
Great Quotes
“If you want to be creative, stay in part a child.” – Jean Piaget
Picture of the Week
Beautiful Wood duck

All content is the opinion of Brian Decker


