
Mitigating Market Risk in Retirement
Our strategies have been helping people with their retirements for more than 30 years, and we have seen a lot of stock market volatility pass us—and our clients—right on by. We don’t like market risk, and we seek to avoid it through our math-based retirement planning methodology, which spells out income, cost of living increases, taxes, RMDs and more up until age 100.
For most of our clients, we have about 75% of their investable assets in laddered principal-guaranteed* accounts which in the last 10 years have averaged a return of more than 6%.
That doesn’t mean we don’t watch and analyze the markets on a regular basis. It’s rather fun, at least for us. For our clients who want or need to, we sometimes do invest approximately 25% of their retirement portfolio—the part they will access when they are age 80 or older—in the markets using a two-sided approach designed to make money whether markets rise or fall.
Our goal is that, when the markets crash every seven or eight years, as they have historically done, it does not send our clients back to work. It doesn’t require them to sell their home, or move in with the kids.
And of the 25% of their money that is exposed to market risk, we’re using two-sided computer algorithms for our risk managers, diversifying them among six managers—including one that is long/short in the S&P 500 or cash and one in the Nasdaq 100, as well as a long/short manager in gold, in silver and in oil. And a long/short manager with Treasury bonds.
That gives us diversification which benefits our clients. In fact, the six managers that we’re using at Decker Retirement Planning have, combined, never lost money in the last 17 years. And they have, combined, beat the S&P 500 for 16 out of the last 17 years.
While we feel confident about our retirement planning methods for our clients, we do want to warn other people who are not our clients and who have stock market risk about what they may be facing.
Market Risk Now
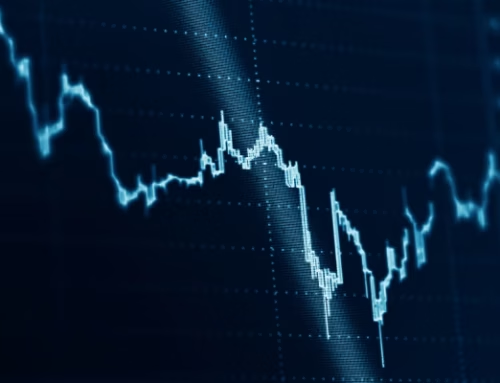
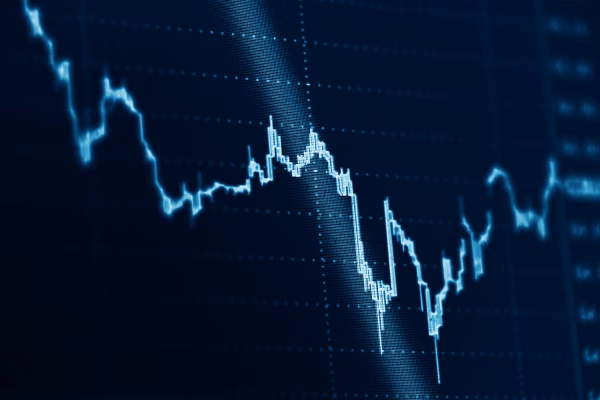
For the last couple of weeks (prior to March 8, 2018), the Advance/Decline Line (AD Line) is positive and the stock markets are trading above the 200-day moving average for the Dow, S&P 500 and Nasdaq. Though we’ve had market closes down 10% twice so far in 2018, the lows have been tested. The AD Line still remains pointed in the upward direction. So, these three important market indicators are still optimistic—still bullish. So far, the market uptrend continues.
As long as that’s the case, anyone with a lot of market risk in their portfolio can be “long and strong” and have their investments continue to grow.
But we warn you, at Decker Retirement Planning, we are constantly on the lookout for chinks in the armor, or bears ready to pounce.
For instance, J.P. Morgan executive Daniel Pinto recently warned that the equity markets could fall as much as 40% percent in the next couple of years. His comments came as investors worry about the effects of the central banks raising interest rates and rising inflation.
Pinto, the bank’s co-president, said in an interview on Bloomberg Television on March 8 that, “It could be a deep correction.” He said the markets are nervous that if President Donald Trump goes beyond what he’s already announced on tariffs, investors could react badly to what could be a worldwide trade war. The stock markets do not like uncertainty. And J. P. Morgan’s CEO, Jamie Dimon, agreed, citing concerns about tariffs and uncertainty about earnings.
Earnings and Buybacks
Earnings growth on the S&P 500 have been fairly stable since Q1 of 2012. From Q1 of 2012 through Q3 of 2017, corporate profits after tax have been flat. Now, most likely they will be going up, and there will be a jump in 2018 due to the tax cuts.
And the picture will look even better on an EPS (earnings per share) growth basis due to record buybacks. Stock buybacks have been the way that companies have increased their earnings per share beyond organic earnings; buying stock back and lowering capitalization is the way that companies have been able to get to the better $.01 – $.02 earnings per share we’ve been seeing.
But none of this is related to the underlying fundamental picture. It’s all the result of artificial intervention, which is what the fiscal tax cut stimulus is—artificial and purely debt finance with massive deficits coming. There has been a wealth transfer from the federal balance sheet to the balance sheets of corporations. There is no evidence, in our opinion at Decker Retirement Planning, that markets can continue to advance without artificial stimulus in place or another free money carrot dangling in front of them.
Historic Market Crashes
In the last several decades, stock markets have crashed every seven or eight years: ‘08, ‘01, ‘94, ‘87, ‘80, ‘73, ‘74, ‘66 and it goes on. Basically, every seven years.
So why haven’t the markets crashed yet? Why are we in year 10 of what’s historically been a seven to eight-year market cycle? It’s because the markets have had huge stimulus in terms of quantitative easing—monetary policy in which a central bank purchases government securities or other securities from the market in order to lower interest rates and increase the money supply—and TARP (Troubled Asset Relief Program), which was signed into law by President George W. Bush in 2008 with the passage of the Emergency Economic Stabilization Act.
Those funds have gone mostly into the stock markets and have funded a huge massive move in the markets. Far beyond where they normally would have gone without that stimulus.
In our experience, when you have a stimulus, you have an artificial expansion that will accelerate the market decline once we do start a downtrend. So instead of the typical 30 – 40% drop, the expectation is that the drop will be even steeper.
There are two reasons stock markets go up. One is higher earnings per share, which we discussed above. And the second, all things being equal, is lower interest rates. Lower interest rates force people to take more risk in the markets because they’re not getting much of a return on their CDs or any of their bonds.
Interest Rate Headwinds
What used to be tailwinds for the last 10 years are now headwinds, because interest rates are starting to go up—not just in the United States, but worldwide.
Everyone is hoping that the Federal Reserve can pull its economic levers just-so, gradually raising interest rates while slowly unwinding its quantitative easing program and withdrawing its unprecedented stimulus efforts, all without triggering a recession.
It’s only been done once before. According to the official record, the Feds pulled this off one time under Alan Greenspan in 1994, when he doubled interest rates without causing a recession. You could argue that the burgeoning tech boom at the time had something to do with that. But every other Federal Reserve tightening cycle has been followed by an economic downturn.
The Tech Sector
Speaking of the 90s tech stock boom (and subsequent implosion in 2000-01, when it experienced a 70% drop), there are some interesting comparisons to be made to today’s tech sector. Nomura, a Japanese financial holding company, suggests that while the tech sector as a whole is not overvalued, the FANG stocks are reaching extremes. (FANG is Facebook, Apple, Netflix and Google.)
In 1998-99, the tech sector had a “blow-off top,” a steep and rapid increase in a security’s price and trading volume followed by a steep and rapid drop in price and volume. The FANG has recently had a blow-off top that, if you overlap them in a chart, is eerily similar.
There’s a very interesting tech-to-utilities ratio, which you can read about here: “A measure comparing riskier tech stocks to safer utilities [which] is triggering memories of what happened just before the dotcom bubble wrecked the market 18 years ago.”

We are now at 70 on a late-cycle chart and that’s right where we were before things came down in ‘08 and before things came down in 2000, ‘01 and ‘02.
The Current Economic Cycle
Asset managers are increasingly convinced that we are in the late stages of an economic cycle, a natural fluctuation of the economy between periods of growth and recession. Factors such as gross domestic product (GDP), interest rates, levels of employment and consumer spending can help to determine the current stage of the economic cycle, according to Investopedia. The current economic cycle is the second longest in postwar history.
When you compare the ratio of household net worth to share of personal disposable income, you can see peaks right before the market drops in ’01 and ‘08. Although it’s not shown on this chart, we are currently at the biggest peak of net worth as a percentage of disposable income that we’ve ever seen, at 6.8.
“Total net worth of $98.75 trillion is now 6.79 times the $14.55 trillion in disposable income, a new high that could be signaling trouble. Previous peaks in 2000 and 2006 preceded recessions, according to Natixis economist Joe LaVorgna.”

Commodities
Historically, every time you are in a late economic cycle going into the front-end of a recession, you have a massive rally in commodities. This is according to Jeffery Gundlach, CEO of DoubleLine. He says there are no exceptions. What we mean by massive is not a 30, 40 or 50% gain, it’s a 100, 200 or 400% gain in the commodities sector when you go from expansion to recession.
Debt
There is currently two and half trillion dollars of outstanding U.S. debt that’s rated BBB. (BBB minus to AAA is considered investment grade. Anything below BBB minus is considered junk bond status.) According to Morgan Stanley, the current $2.5 trillion is up from $1.3 trillion of debt that we had only five years ago, and up from only $686 billion a decade ago. This is the highest amount ever for BBB-rated debt, near the lowest rung before it moves into junk bond status.
American corporations have never carried so much debt relative to GDP (gross domestic product) before, and its overall quality has never been lower. The total size of this BBB-rated corporate debt is twice the size of the entire junk bond market.
When it comes to US Treasury debt, the Treasury Department is expected to issue over $1 trillion of debt each year for the next four years. This is in addition to the $21 trillion debt load that’s currently outstanding and must be refunded when the bonds mature. Even more troubling is the growth rate of forecasted debt for the United States is almost twice the size of the CBO, Congressional Budget Office’s most optimistic economic growth forecast.
Additionally, right now all G7 nations—for the first time ever—have debt above 100% of their GDP. That’s never happened before. And in the U.S., we have 20% of the United States’ budget that’s relegated to pay interest on our debt. If that interest goes up, we’ll have a huge portion—30 to 40% of our budget—that’ll have to be set aside just to pay interest.
Debt Default
Such a divergence between the debt burden and the means to pay that debt cannot continue indefinitely. So, do we have a disaster bubble with debt? Absolutely. The CBO (Congressional Budget Office) is projecting that the coming explosion in debt doesn’t even presume a coming recession. The debt issue becomes a problem even if we continue the expansion of 2 to 3% GDP growth.
At Decker Retirement Planning, we predict that the next default cycle we have in this country will be the most devastating financial crisis in our history—far worse than the events of ‘08 and ‘09. For now, we don’t see any signs of stress, but watch for this to happen. In the last decade, because of artificially-low interest rates set by the Federal Reserve, we had the tech bubble burst in 2000 which caused a 50% drop in the S&P 500. We had the huge mortgage bubble that burst in 2008.
That was then. Because of artificially-low interest rates now, we believe we will have four bubbles that will burst when interest rates go back up. Number one is debt—corporate debt, personal debt, and country debt—which we just reviewed. There are three more.
Bond Market Bubble
The second bubble we see bursting is the bond market bubble. We have an insatiable worldwide craving for interest—to try to get higher bond interest no matter how risky. And now common sense has been thrown aside. For example, you have the comparison of the 10-year Treasury with the United States, which is at 2.7%. But 130 basis points above that is the 10-year bond rate for Greece. Greece is in a disaster situation and their 10-year is at 4%, not even 1.5% above of where we are at. Yet bond funds are investing there. Lack of common sense and the desire for putting money wherever there is any higher yield, in complete disregard of market risk is what’s happening today.
The bond markets used to buy debt that was issued with covenants, where the debt was linked to some kind of securitization. Now, that’s not the case. We call it covenant-lite debt. That’s the typical case now, and we have the bond market in bubble territory worldwide.
Real Estate Bubble
The third bubble we have is real estate. That’s seen by the affordability index, with a gap that has broken records from the peak of the market in 2008.
Stock Market Bubble
And finally, we have the current trailing price-to-earnings. (The trailing P/E is calculated by dividing the current market value, or share price, by the earnings per share over the previous 12 months.) By this measure, the stock market valuation shows ratios 25 times earnings right now.
We have only hit 25 times earnings three times ever in history. One was in 1929. (Ten years after that, the market still hadn’t made up what it lost.) The other one was 1999. (Ten years later the market still had not recovered what it lost.) And the third and final time of the markets trading at such a rich valuation of 25 times trailing earnings was the third week in January of 2018.
Demographics
Right now in the United States, things are getting better economically only for the very few. The top 10% of the United States’ median family net worth has received tremendous benefit in the last 10 years with exposure to the stock market via their 401(k)s and their other investments.
But the other 90% of the US population doesn’t have much in savings, mostly because wages and income growth just hasn’t kept pace. Since 1980, income growth has been relatively flat, or even down, when you take into account inflation. The gap—the gap between income and net worth in the United States—has never been this lopsided, and this type of income disparity has historically (and will) create problems for any country in the world.
Downside Protection from Market Risk in Retirement
At Decker Retirement Planning, our company is all about helping create downside protection from market risk in retirement. We watch the “canaries in the coal mines” economic indicators as well as “market risk” closely here, and will continue to do so. And we encourage you to make sure you’ve got downside protection in your retirement income plan.
We focus on four things for the retiree:
- We do everything possible to help make sure that you are taking the appropriate level of risk, and that you have risk minimization measures in place if the markets do fall apart.
- We work to help make sure that you have the income that you need and want for the rest of your life.
- We run the numbers to help make sure your taxes are minimized.
- We focus on protecting your assets, like recommending you obtain an umbrella policy for liability coverage, helping make sure that if you have insurance, that you have the right amount for income replacement or long-term care.
All four of these are very important parts of your retirement plan.
If you have any questions, please give us a call at Decker Retirement Planning, 855-425-4566. We’ve got offices in Seattle and Kirkland in Washington, and an office in Salt Lake City, Utah. And we’re opening an office soon in San Francisco, California.
*For more information about the integrity of the three types of principal-guaranteed* accounts, < click here.


