

Economy
Job growth in April exceeded expectations, with substantial losses recorded only in the federal government. The unemployment rate held steady at 4.2%. As the share of Chinese imports to the US has declined, other regions have seen a rise.
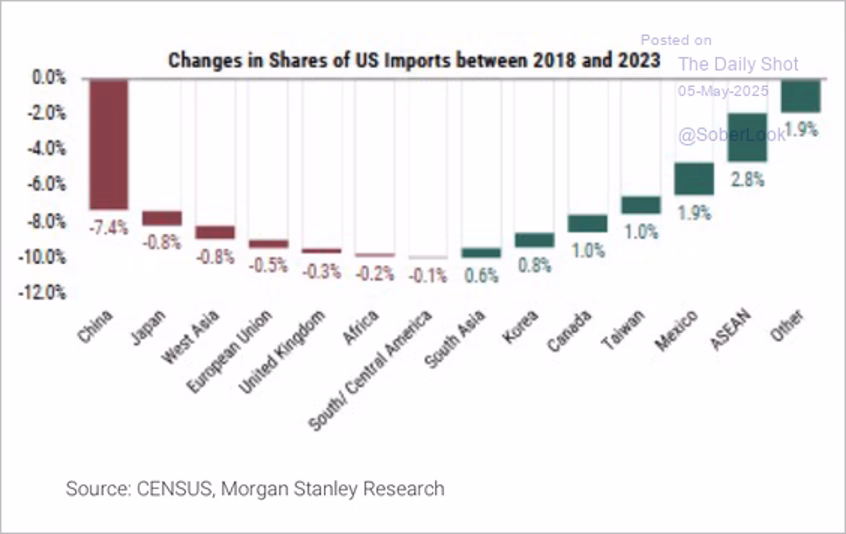
China’s share of U.S. imports declined significantly from 2018 to 2023, while ASEAN and Mexico saw notable gains. (Source: Morgan Stanley Research, Census)
Source: Morgan Stanley Research
The total US trade deficit reached a record $140.5 billion in March, driven by tariff frontrunning and weaker service exports.
Total private investment in artificial intelligence by country from 2013 to 2024.
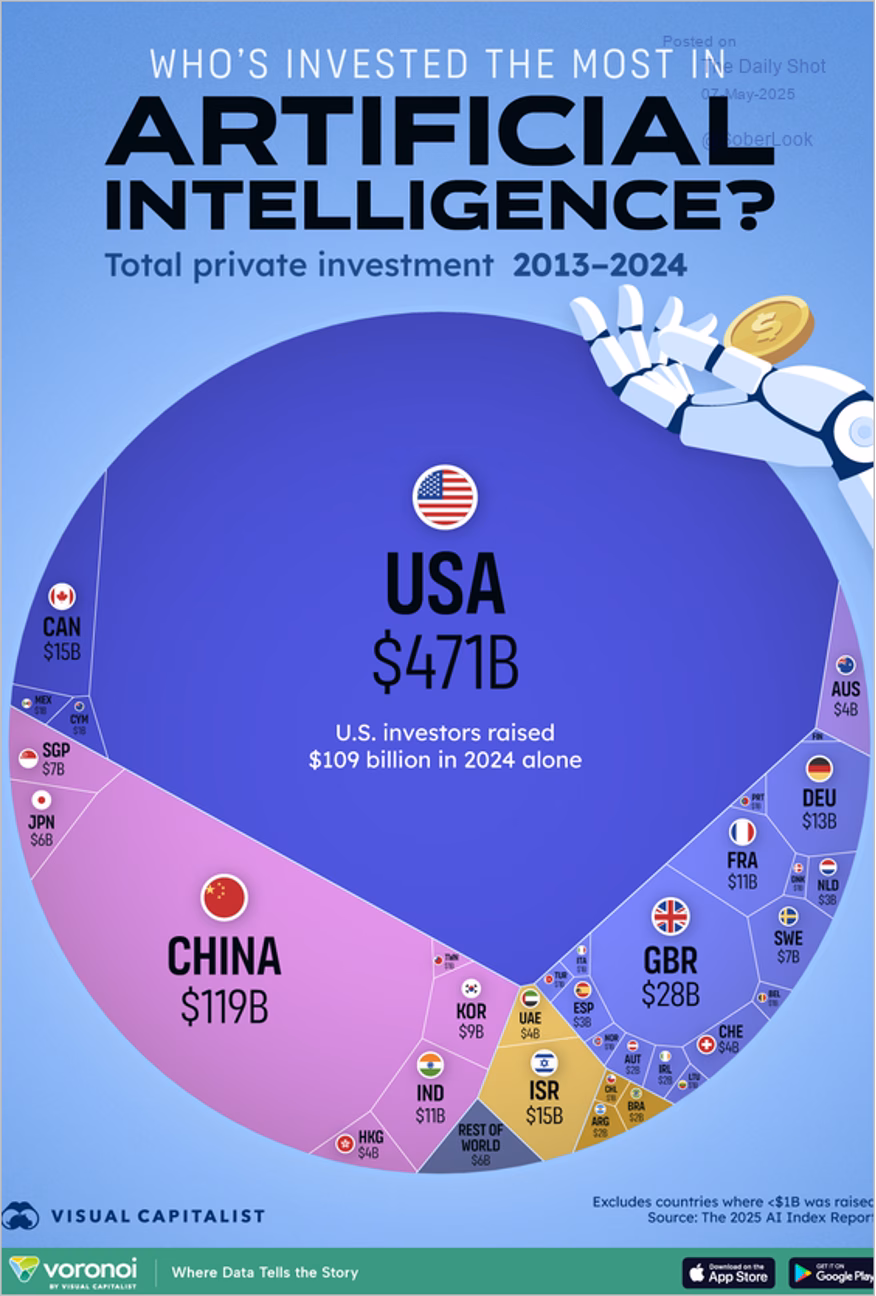
The U.S. has led global AI investment with $471B in funding, far surpassing China and other nations. (Source: Visual Capitalist, Index Report 2024)
Personal bankruptcy filings remain low. US pharmaceutical imports by country:
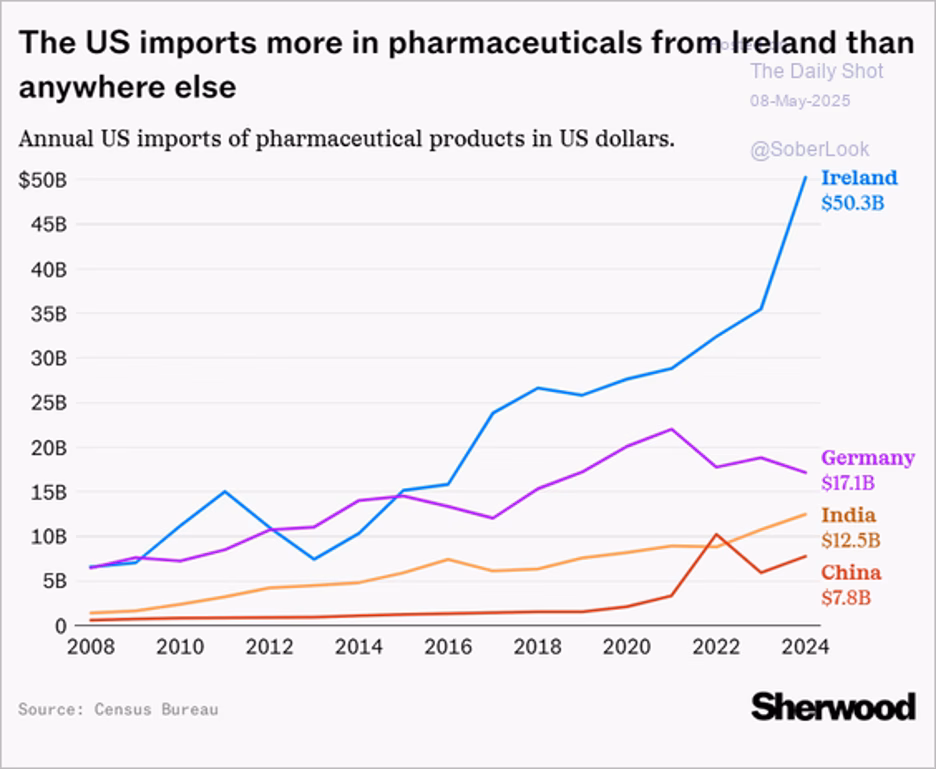
Ireland dominates U.S. pharmaceutical imports, reaching over $50B in 2024, far ahead of Germany, India, and China. (Source: Census Bureau)
Source: @chartrdaily
Labor productivity declined for the first time in almost three years last quarter. Unit labor costs jumped.
Markets
The US dollar is moving lower again, …
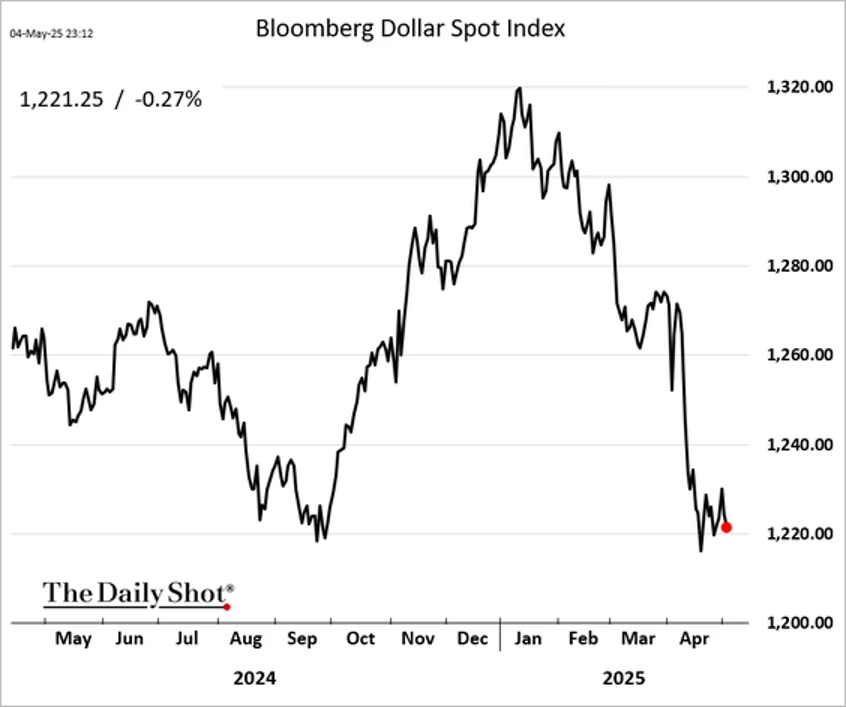
The U.S. dollar has weakened sharply since early 2025, reflecting shifting investor sentiment. (Source: The Daily Shot)
… as sentiment toward the currency continues to weaken. The number of S&P 500 companies issuing downward earnings guidance has surged well above average, marking the second-highest level since early 2020 and signaling growing corporate caution.

Downward earnings revisions have spiked, with 62 companies lowering guidance in early 2025—well above average. (Source: @SoberLook)
US equities have dominated global inflows year-to-date, attracting nearly five times more capital than Europe and far outpacing flows into Japan. India has seen modest outflows.
US companies have announced a record volume of share buybacks through early May, surpassing the previous highs seen in 2022 and reflecting continued corporate preference for returning capital to shareholders.
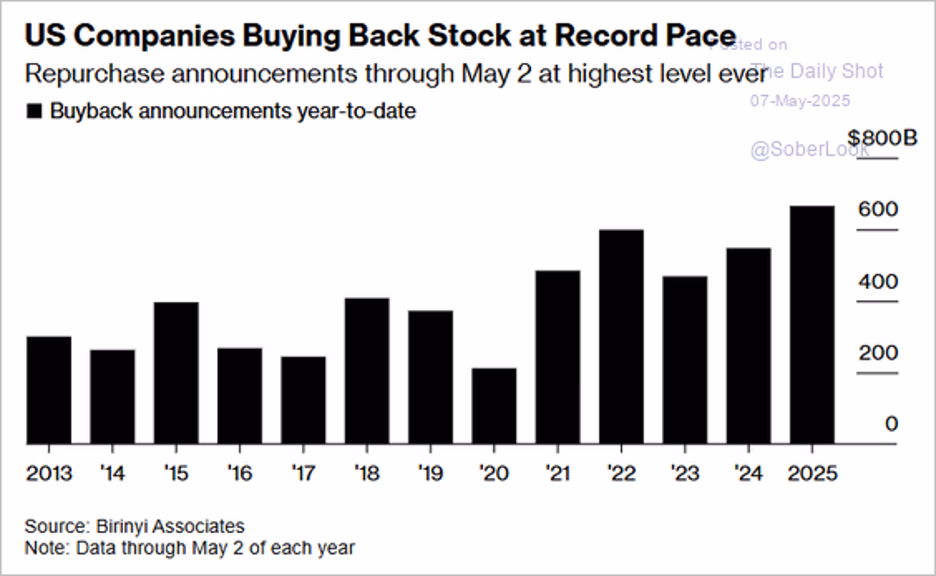
U.S. companies are on track to set a new record for stock buybacks in 2025, continuing a long upward trend. (Source: Birinyi Associates)
This chart shows US bear market declines (and durations) by type since the 1800s.
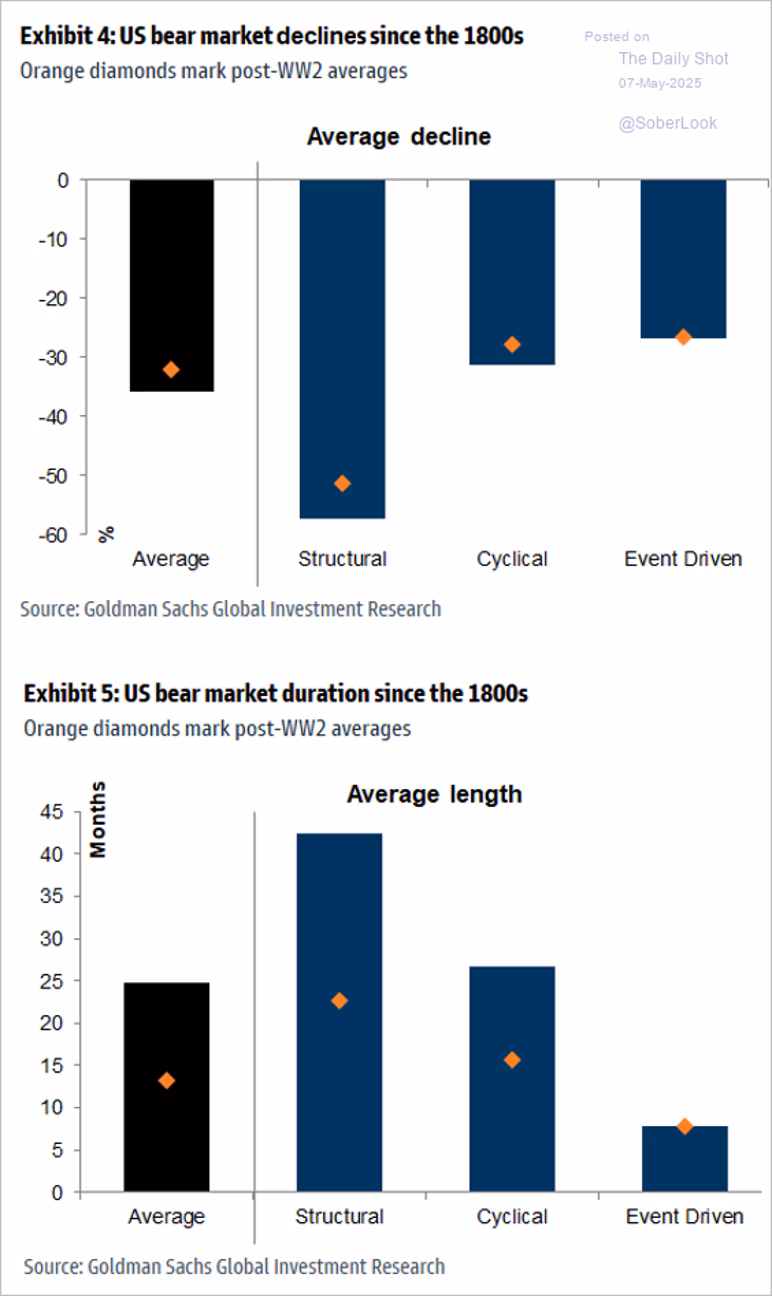
Structural bear markets have historically been the deepest and longest, followed by cyclical and event-driven declines. (Source: Goldman Sachs)
With Brent crude at $61.8 per barrel, all five major Western oil companies are now below their dividend-plus-buyback breakeven thresholds—posing a risk to shareholder return commitments if prices remain depressed.
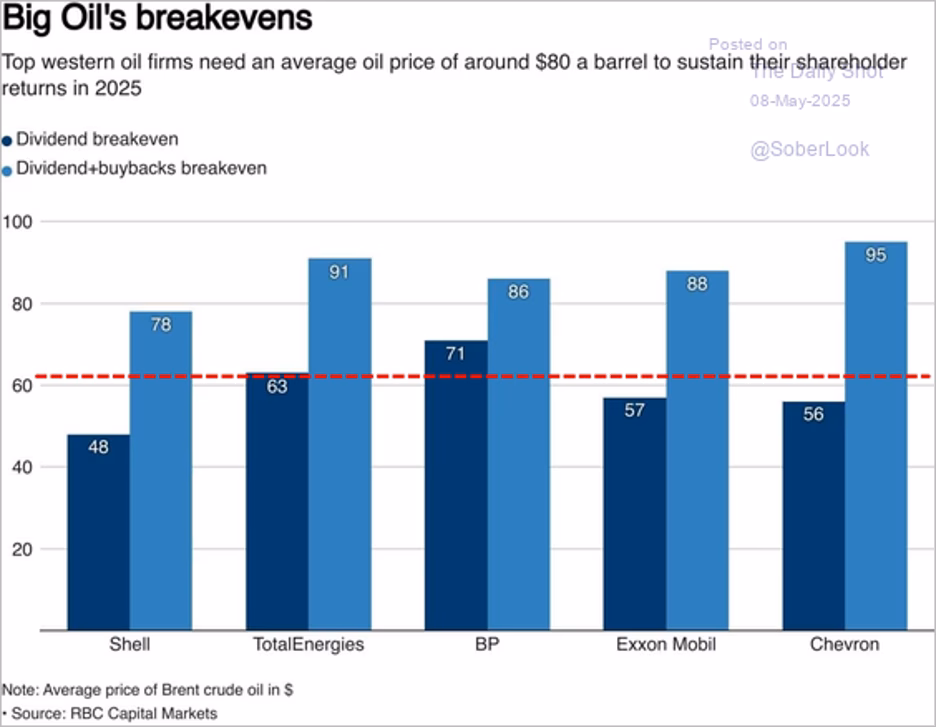
Most major oil companies need prices above $80/barrel to sustain shareholder returns via dividends and buybacks. (Source: RBC Capital Markets)
Semiconductor stocks climbed after the Trump administration unveiled plans to overhaul restrictive AI chip export rules.
The Nasdaq 100 is still testing resistance at the 200-day moving average.
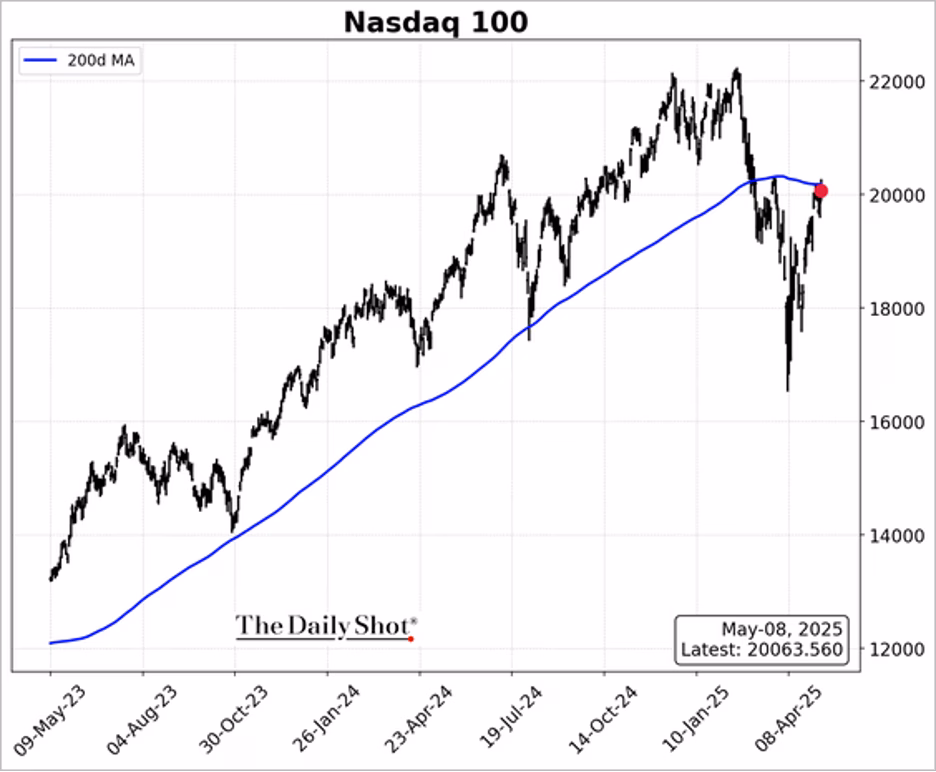
The Nasdaq 100 is testing resistance at the 200-day moving average, signaling a pivotal technical level. (Source: The Daily Shot)
This chart shows sector performance since April 8th bottom.
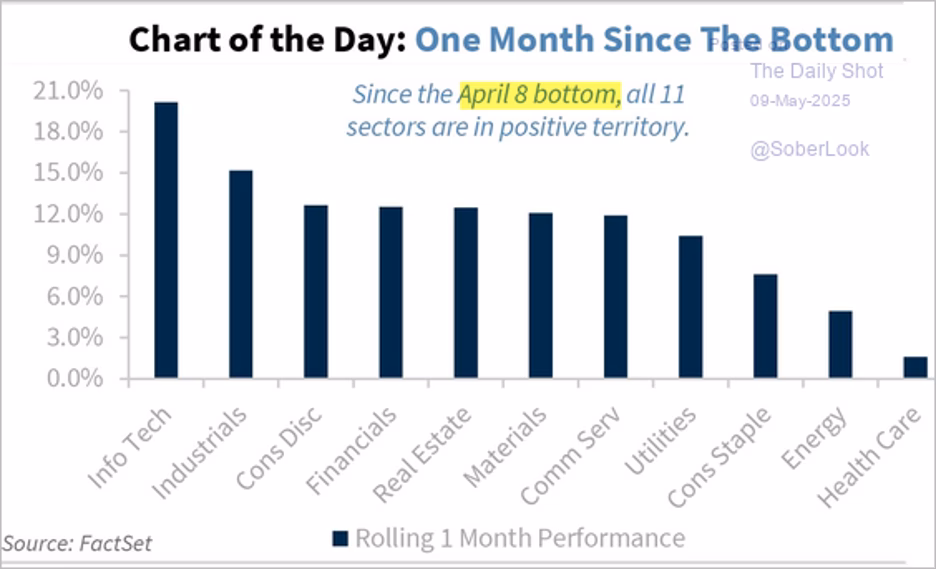
All 11 sectors posted gains since the April 8 market bottom, with Info Tech and Industrials leading. (Source: FactSet)
The Fed
As expected, the Fed held rates steady, but the FOMC meeting marked a notable shift in tone, highlighting rising concerns over stagflation risks amid escalating trade tensions. Powell underscored the uncertainty surrounding the duration and impact of tariffs, stating, “I don’t think we can say which way this will shake out.” While noting that the labor market remains strong, he pointed to a sharp decline in consumer and business sentiment, with many delaying decisions due to policy uncertainty. He added that the costs of waiting are “fairly low,” giving the Fed room to remain patient with policy adjustments. Here are the key changes from the FOMC’s March statement.
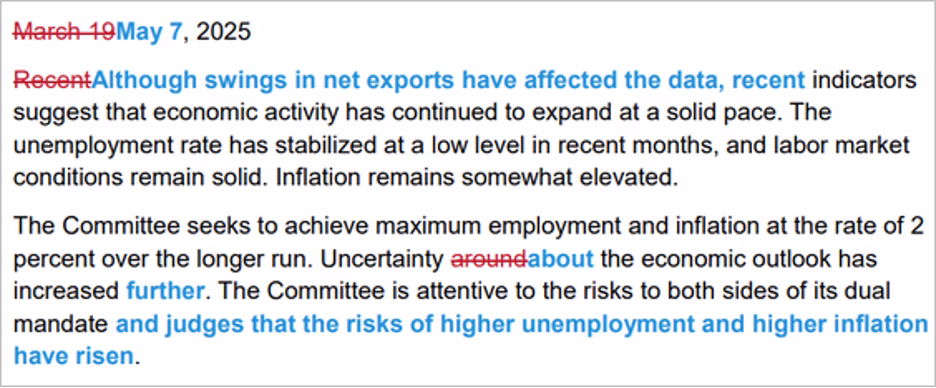
The May FOMC statement emphasized rising risks of unemployment and inflation while showing increased caution about economic uncertainty.
The market continues to price in three rate cuts this year. Fed officials’ communications have been trending more dovish, according to Bloomberg’s natural language processing model.
Tariffs
Today marked 80 years to the day that the U.S. and the U.K. partnered to help end World War II in Europe, Trump noted in his announcement. And in a roughly hourlong event in Washington, Trump called this deal the “first in a series of agreements” that the U.S. plans to make with trading partners in the name of “reciprocity and fairness.”
The terms were initially less clear – “the final details are being written up,” Trump said in an opening statement. But as the president spoke, a graphic appeared on his Truth Social account, saying that the deal opens a path for $5 billion of U.S. exports and $6 billion of tariff revenue.
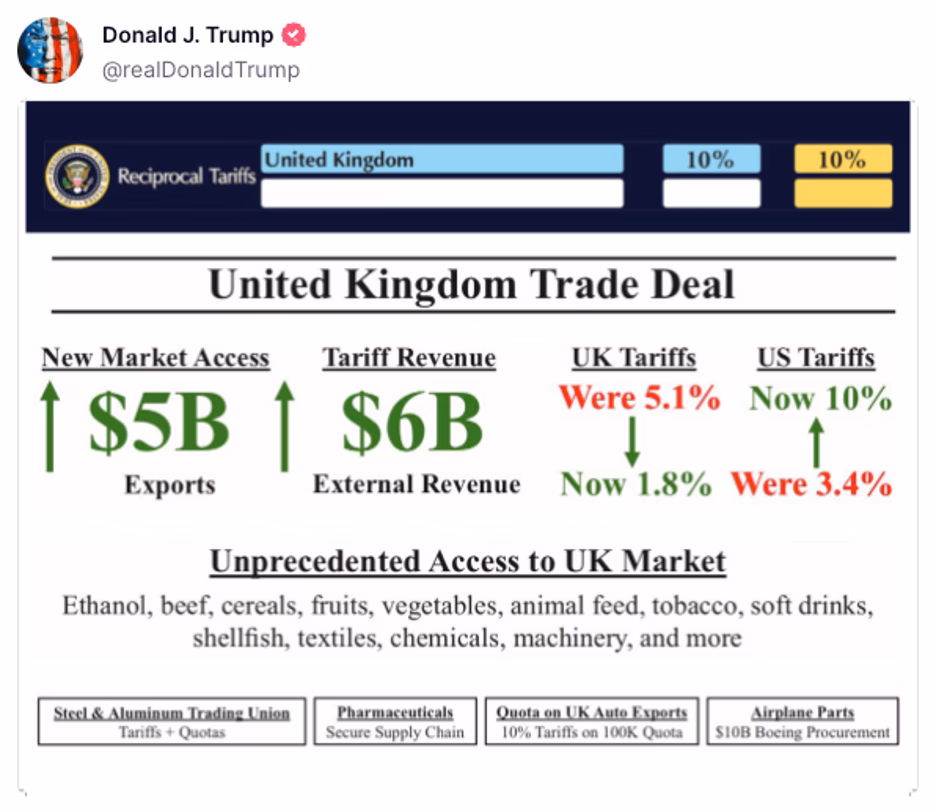
The new U.S.-UK trade agreement includes lower tariffs and greater access for U.S. goods, projected to generate $5B in exports and $6B in tariff revenue.
Members of the White House administration and the U.K. leadership gathered around Trump in the Oval Office. They spoke about the U.K. “opening their markets” to ethanol (dropping a U.K. tariff from 19% to zero), beef, and machinery, while “protecting” U.K. workers, too, U.S. Commerce Secretary Howard Lutnick said.
The U.S. will keep a fresh 10% tariff on all U.K. imports in place… But Trump decided to cut tariffs on the first 100,000 imports of cars each year from the U.K. from 25% to 10%, and the U.S. will ease import costs on Rolls-Royce engines that Boeing (BA) uses to build airplanes. Lutnick said an unnamed British airline will buy $10 billion in Boeing aircraft. Reports say it is British Airways parent International Airlines Group.
Furthermore, the U.K. has agreed to align steel and aluminum policy with the U.S. to combat “dumping,” with the clear but unnamed target being Chinese exports. Tariffs on U.K. aluminum and steel will drop to zero. There was also some talk of the U.S. and U.K. creating a “technology partnership” for national security reasons.
US imports of movie and TV production services by region:
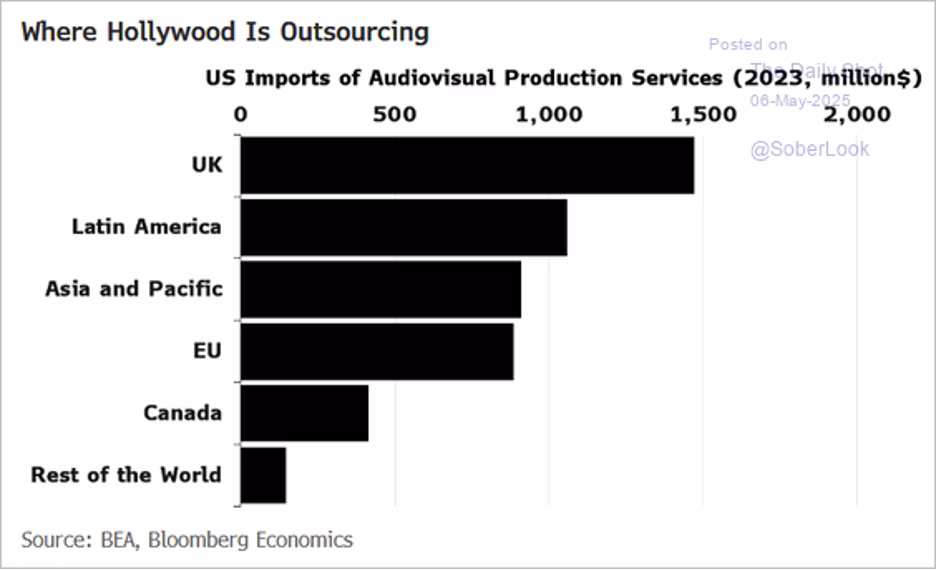
The UK remains Hollywood’s top outsourcing partner for production services, followed by Latin America and Asia-Pacific. (Source: Bloomberg Economics)
Goods exports as a share of nominal GDP by country:

South Korea, the EU, and Mexico lead in export dependency, with the U.S. ranking last at just 11%. (Source: Visual Capitalist)
Source: Visual Capitalist Read full article
US share of total sales for major foreign car brands:

The U.S. is a critical sales market for foreign carmakers, representing 39% of Honda’s sales and 29% for Hyundai. (Source: Visual Capitalist)
The US and China are set to hold talks last weekend, fueling hopes for an easing of trade tensions.

U.S. and Chinese officials plan to meet in Geneva for trade discussions aimed at easing tensions.
Source: Reuters Read full article
Goldman anticipates that the recent surge in US-China tariffs will ease by mid-year, though rates are likely to remain very high by historical standards, indicating a shift from punitive to persistently restrictive trade conditions.
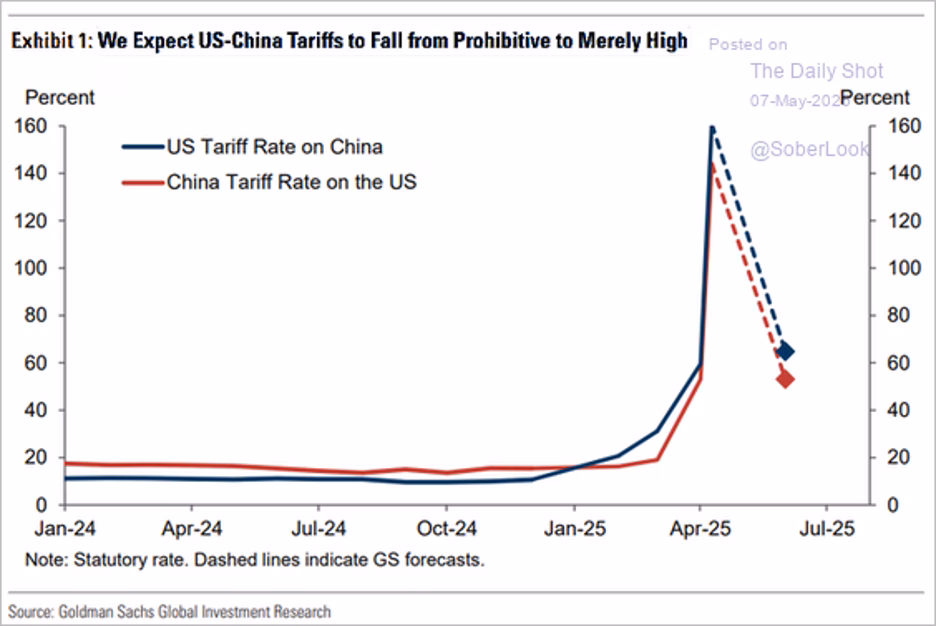
Both countries are expected to lower punitive tariffs to more moderate levels, easing trade barriers. (Source: Goldman Sachs)
Source: Goldman Sachs; @MikeZaccardi
US imports of medicinal and pharmaceutical products surged to unprecedented levels, now outpacing total goods imports from Ireland—highlighting the outsized role of pharma in the recent trade deficit spike.
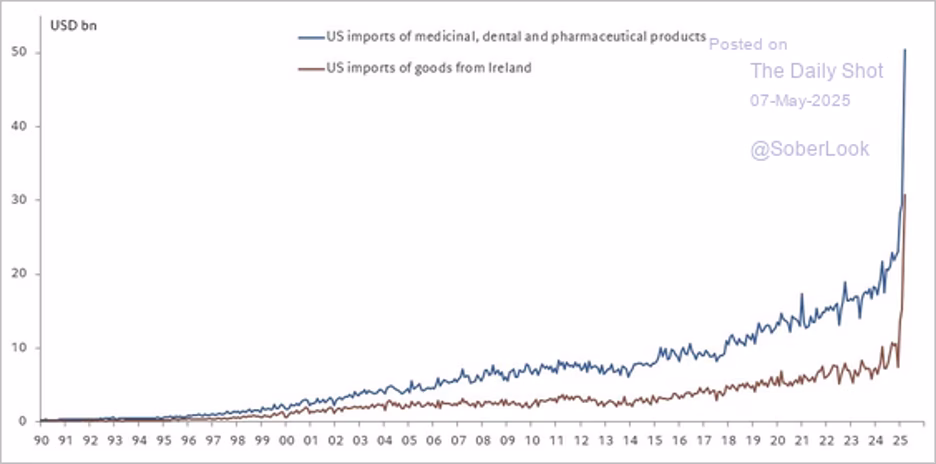
U.S. pharmaceutical imports from Ireland have sharply outpaced all other Irish goods. (Source: The Daily Shot)
Source: @fwred
The trade deficit with Mexico reached a new record, while deficits with Canada and China narrowed as imports from those countries declined.
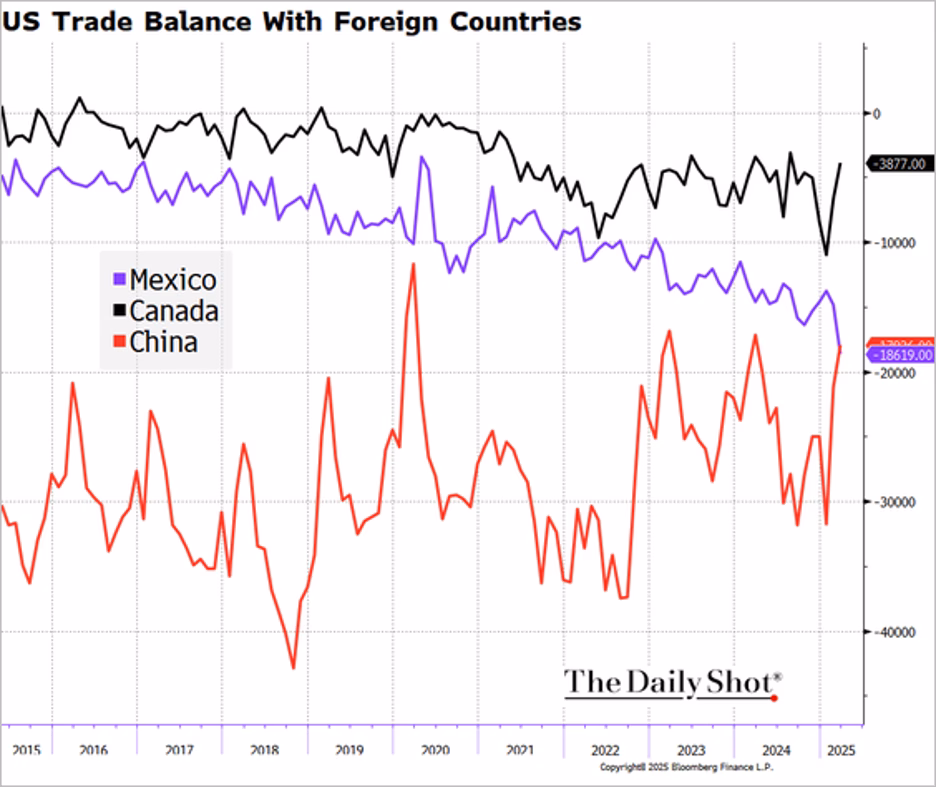
The U.S. trade deficit with Mexico continues to widen, while gaps with Canada and China are stabilizing. (Source: Bloomberg Finance L.P.)
US retail inventories are relatively low.
Canada’s exports to the US dropped 6.6% in March—the steepest monthly decline since 2020—just as new US tariffs took hold. While surging non-US exports helped stabilize the overall trade balance, the data highlight growing pressure on Canada’s core export relationship.
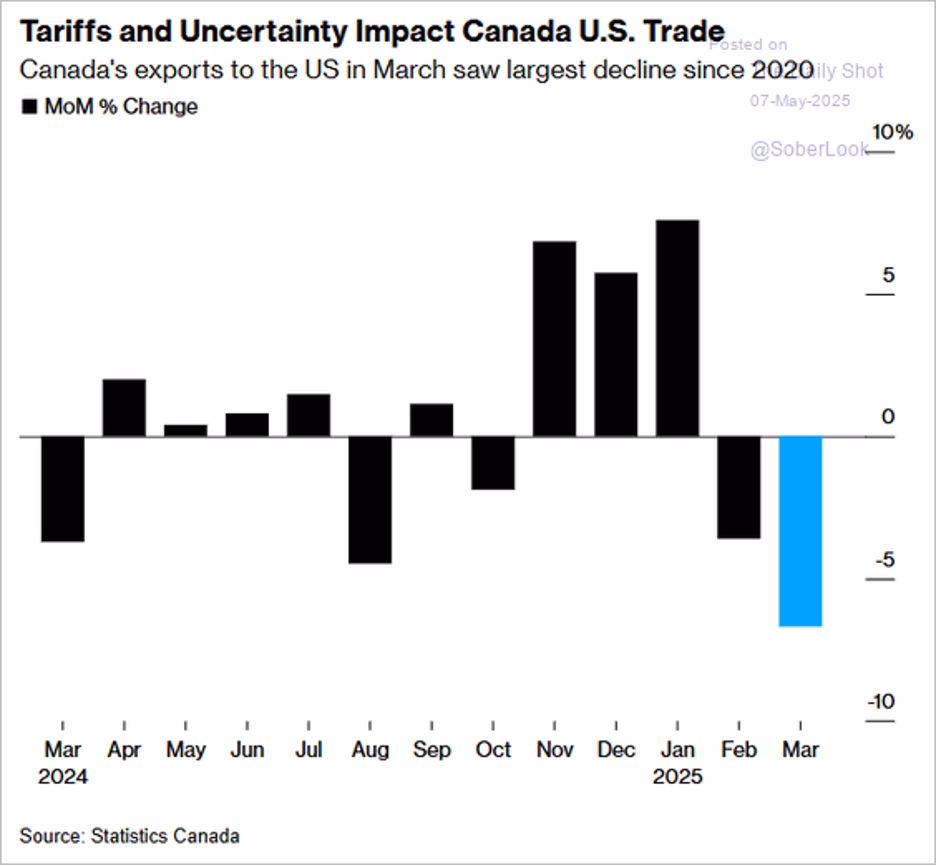
Canada’s exports to the U.S. fell sharply in March 2025—down 6.6%—marking the steepest monthly decline since 2020. (Source: Statistics Canada)
The EU posted a €48 billion trade surplus with the US in 2023, driven by a strong surplus in goods that more than offset a services deficit. As Brussels prepares to propose a package of concessions and sectoral cooperation to defuse tensions, the data highlight the underlying imbalance that continues to fuel Washington’s tariff push.
Trade deals are typically slow-moving processes—averaging 18 months to sign and nearly four years to implement – highlighting the gap between political announcements and actual economic impact.
Great Quotes
“Before you marry a person you should first make them use a computer with slow internet to find out who they really are.” – Will Ferrell
Picture of the Week
Leopard family

A serene moment captured in the wild: a leopard mother watches alertly as one cub affectionately grooms its sibling. Featured as the Picture of the Week.
All content is the opinion of Brian Decker


