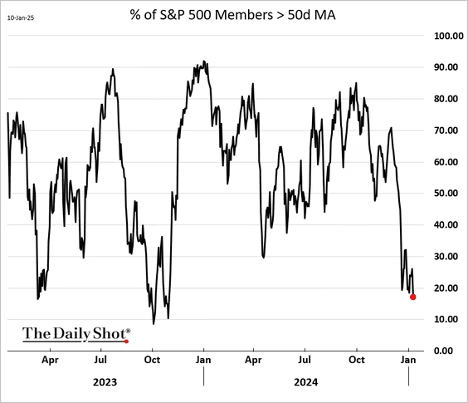
The strong employment report and higher inflation expectations boosted Treasury yields and the dollar. Mortgage rates rose further to 7.25%. Equities sold off. S&P 500 breadth continues to weaken (2 charts).
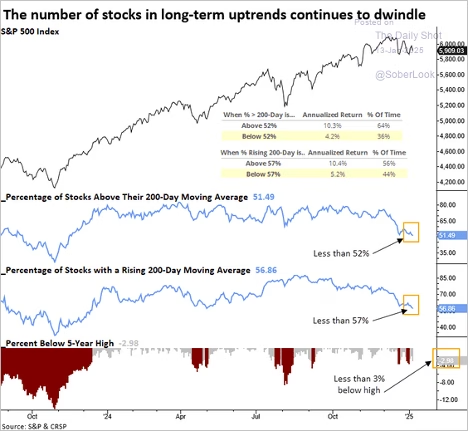
Source: SentimenTrader
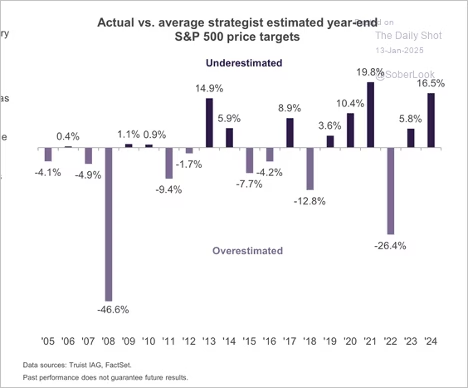
Small caps have struggled in recent weeks as bond yields climb. Small caps have given up their post-election gains. Retail investors are turning more cautious on the market. The US dollar’s ongoing rally will be a drag on corporate revenues. Analyst price targets for the S&P 500 are typically far off.
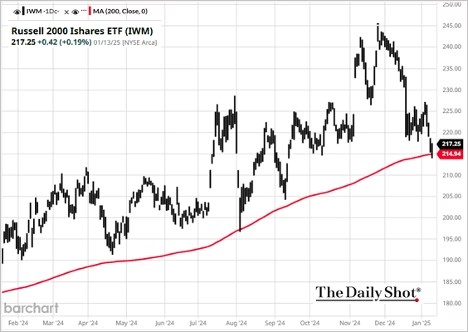
The Russell 2000 held support at the 200-day moving average.
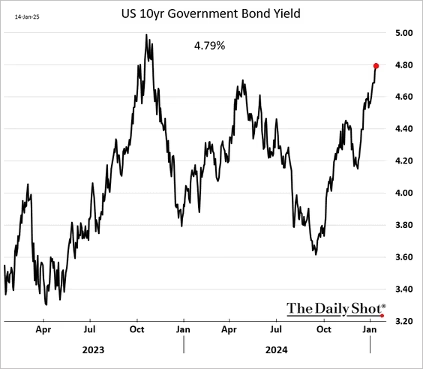
Investment newsletters’ equity allocation has been falling. Treasury yields continue to rise, with the long-bond yield nearing 5%.
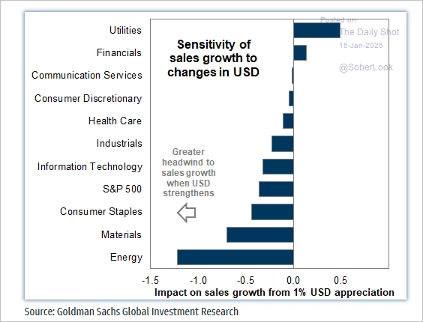
Implied EPS growth for 2025 is set at an ambitious 23.5%, far exceeding bottom-up consensus and macro estimates. Elevated market expectations could challenge valuations if earnings disappoint. Here is an overview of sector sales growth sensitivity to fluctuations in the US dollar.
Companies are likely to raise concerns about US dollar strength during earnings calls. US small-cap earnings estimates have been in a pronounced downgrade cycle, diverging from large caps.
Treasury yields dropped sharply following the softer-than-expected core CPI print. Market-based inflation expectations eased. Stocks jumped, driven by the decline in bond yields.
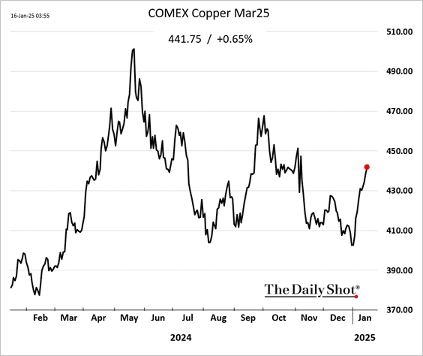
Copper futures continue to rebound.
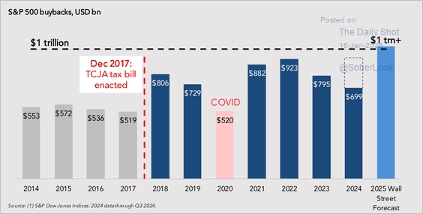
S&P 500 stock buybacks are likely to exceed $1 trillion.
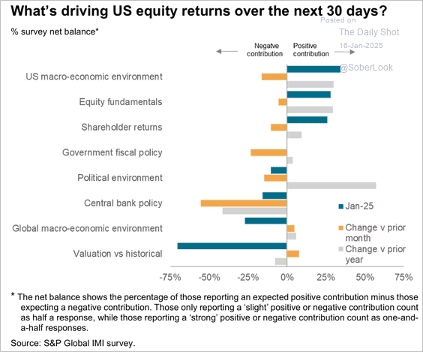
What will drive US equity returns over the next 30 days?
According to Vanda Research, retail investors tend to concentrate their purchases in January and February, with these months accounting for over 20% of annual activity on average.
Economy:
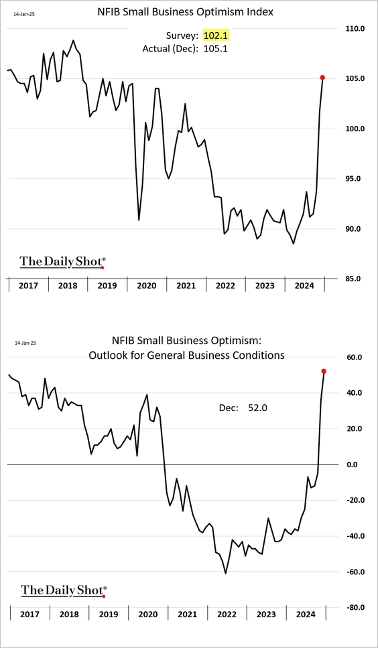
The University of Michigan’s consumer sentiment index edged lower this month, with the current conditions indicator rising while the expectations subindex fell. Consumers are not optimistic about growth in personal income. Inflation expectations spiked in anticipation of upcoming tariffs. . The NFIB small business sentiment has surged following the elections, with the sales expectations index rising to pre-COVID levels. Hiring plans improved further. Despite all this optimism, small businesses, on average, cut employment levels in December by the largest margin since the Global Financial Crisis. It’s difficult to reconcile significant improvements in outlook with substantial reductions in staffing.
December retail sales rose for the fourth consecutive month, though the headline figure came in below expectations, weighed down by building materials. The Atlanta Fed’s GDPNow estimate for the Q4 GDP growth got a boost from the robust retail sales report, now estimating 3% growth this year.
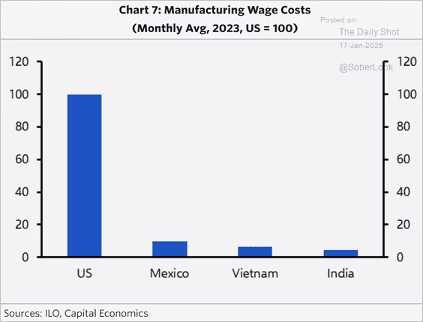
The Philly Fed’s regional manufacturing index surged this month. This bodes well for factory activity at the national level. Bringing manufacturing jobs back to the US is a tall order.
The Fed
December job gains significantly exceeded economists’ forecasts, casting doubt on the anticipated Fed rate cuts this year. Healthcare, Leisure & Hospitality, and state and local government continue to make up a substantial portion of job gains. Job growth has been much slower when these sectors are excluded. According to Pantheon Macroeconomics, December payrolls benefited from one of the most generous seasonal adjustments on record, likely inflating the reported figures. A recalibration of seasonal factors could result in downward revisions to employment data. The unemployment rate declined to 4.1%. Wage growth slowed in December. Rate cut expectations have been scaled back substantially. The market is now pricing in only 29 bps of rate reductions this year, and 46 bps in total (for this cycle).
Producer price gains in December came in well below expectations, with core PPI nearly flat for the month. However, wholesale passenger transportation prices spiked, indicating the potential for faster core PCE inflation, the Fed’s preferred measure. This chart signals a sharp increase in the PCE air transport price index. Investors increasingly anticipate tighter financial conditions as the Fed maintains its restrictive stance amid persistent inflation.
Inflation picked up in December, driven by an increase in gasoline prices. However, the core CPI rise came in below expectations. The market raised expectations for upcoming Fed rate cuts, now pricing 38 bps of reductions this year, and 58 bps in total for this easing cycle.
More Tariff Talk
Many investors are talking about the policies that will be enacted under the new administration. The most controversial economic approach has clearly been tariffs, which may be leveled against China, Canada, Mexico, the EU, or other blocs and nations. Here’s a rundown of what Team Trump is looking to get out of tariffs, and why they might be the best tool or bargaining chip to deal with everything from manufacturing and trade to the fiscal deficit.
Treasury Secretary Scott Bessent: “The truth is that tariffs have a long and storied history as both a revenue-raising tool and a way of protecting strategically important industries in the U.S. President-elect Trump has added a third leg to the stool: tariffs as a negotiating tool with our trading partners. Our size gives us market power and the ability to dictate terms – other countries need us more than we need them. We have but to use that power.”
Commerce Secretary Howard Lutnick: “When you’re running for office, you make broad statements so that people will understand you. Tariffs are an amazing tool for President Trump to use, and he understands ‘don’t tariff stuff we don’t make’ and ‘Build In America.’ We can’t sell a Ford (F) or GM (GM) in Europe because there are 100% tariffs. In Japan, [also] 100% tariffs [stemming from the Marshall plan]. How about we say, ‘we are going to tariff you like you are going to tariff us.’ Of course, they’re going to come in and negotiate, and their tariffs are going to come down.”
U.S. Trade Representative Jamieson Greer: “Tariffs can help support U.S. manufacturing jobs in particular, especially to the extent that they’re remediating an unfair trade practice. If you level out that playing field, it makes it so that Americans don’t have to compete unfairly.”
National Economic Council Chair Kevin Hassett: “If you look at the Republican platform, the first listed trade policy is the Reciprocal Trade Act, which takes U.S. tariffs to the levels that our trading partners charge us… What happens to inflation? Well, what’s the next best supplier? What’s the cost ratio between them? And if we bring new stuff to the U.S., what’s the marginal effect of the marginal cost? Don’t forget that the tariff affects the price level when it goes in, not the long-run inflation rate… Basically, it’s a level adjustment.”
Chairman of the Council of Economic Advisers Stephen Miran: “In the real world, we have a one-sided free-trade policy in which America isn’t nearly as protectionist as other countries. Trump’s proposed tariffs could generate some $450B in revenue a year for the U.S. Isn’t it better to tax foreign entities for entering the American market than impose new taxes on American families? We [also] need targeted tariffs to lift such critical industries as defense. The U.S. relies heavily on imports to make the weapons and other material our military needs. This doesn’t make sense.”
White House Senior Trade Counselor Peter Navarro: “We put on significant tariffs on China, steel, aluminum, dishwashers, solar, a lot of increased countervailing duties to stop the dumping [in Trump’s first administration]. We had zero inflation from any of that. It never happened, and it’s the same movie this time. Inflation is a monetary phenomenon, where we run a Federal Reserve that prints too much money, and they do that to accommodate fiscal irresponsibility.”
Great Quotes
David Bowie: “If you feel safe in the area you’re working in, you’re not working in the right area.”
Picture of the Week
Acorn street, Boston Mass

All content is the opinion of Brian Decker


