

The second quarter delivered the strongest S&P 500 earnings growth in a non-recession recovery since 1992, and investors responded by getting more bearish, not less. This week’s roundup walks through the numbers: the August jobs report, what it now takes to afford a median-priced home, how much of the earnings growth came from AI infrastructure and how much came from everyone else, and where the Russell 2000 sits after slipping below its 100-day moving average.
US Economy
The Atlanta Fed’s GDPNow model is tracking Q3 GDP at a still solid 4.4%.
Nonfarm payrolls surged by 162,000, well above consensus, with private payrolls jumping by 127,000. Data for the previous two months were also revised up by 55,000. Job gains were led by a rebound in leisure and hospitality, while the information sector was the weakest. AI still appears to be weighing on employment. The pace of job growth at goods producers is outpacing that at service providers. The unemployment rate rose by five basis points to 4.14%, reflecting a 569,000 increase in household employment and a much larger 683,000 increase in the size of the labor force.
The Tax Foundation argues that, after excluding depreciation and taxes, capital receives roughly 23%–32% of US net income, …
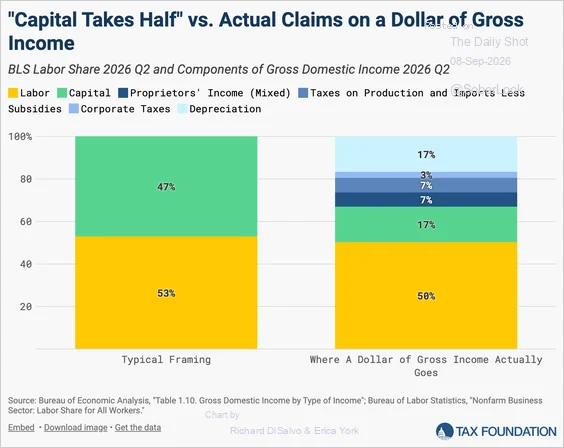
Capital versus labor share of gross income. Source: Tax Foundation
While labor’s share remains within its historical range.
Mortgage applications edged down as the 30-year fixed mortgage rate ticked up. The median age of first-time homebuyers was unchanged at 33 in Q2 2026, while the average edged up to 35.9 years. The Atlanta Fed calculates that a household would need an annual income of $124,674 to afford a median-priced home. That’s 5% more than what a median household makes. Homebuilder stocks fell into bear market territory.
Broadly speaking, market-implied recession probabilities are low. The Port of Los Angeles completed its busiest three-month run on record.
US Stock Market
Let’s start with the good news, because there is plenty of it. Second-quarter S&P 500 earnings grew roughly 31% year over year on an adjusted basis, well ahead of the 23% the Street had penciled in before the season. Bloomberg calls it the strongest non-recession-recovery profit growth in its data going back to 1992. AI infrastructure did most of the heavy lifting. By BlackRock’s math, AI-related names drove close to 60% of the index’s earnings growth, and three hyperscalers account for roughly 70% of what analysts expect for the full year.
Yes, there are reasons to be skeptical of the earnings growth, such as one-time investment gains that are boosting the numbers. However, there is a part that the bears keep glossing over. The rest of the index is finally pulling its weight as well. When you strip out energy, and the AI build, and the other roughly 490 companies still grew earnings 14% in the second quarter, a number that would headline most years on its own. The “broadening” everyone keeps asking for is finally showing up in the profit data itself, not the hope column.
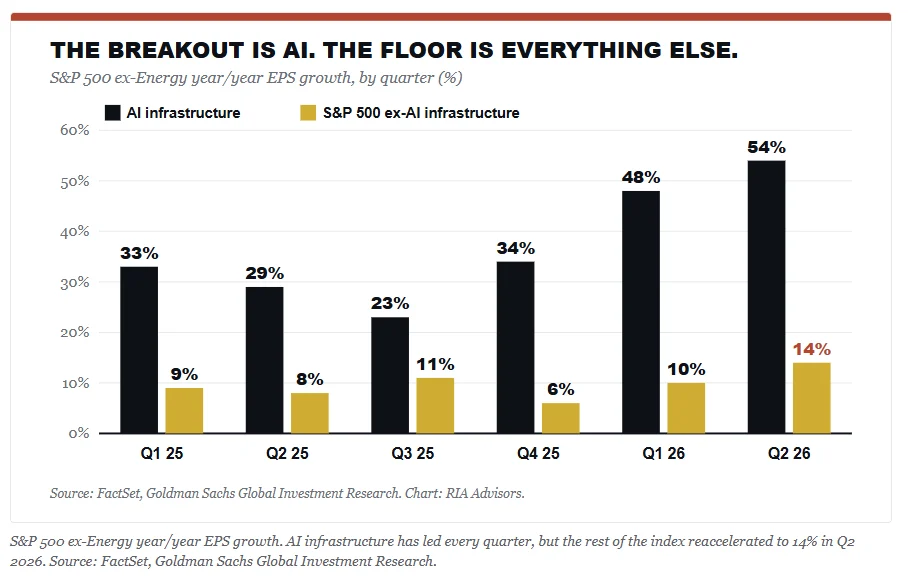
S&P 500 earnings ex-AI infrastructure
This rally is earnings-led, not multiple-led, and that single fact is what separates it from 2000. Look at the revisions. Forward earnings estimates have climbed for most of the year, while the forward multiple has drifted lower. Price has been chasing profits, not the other way around. Hyperscaler capital spending is running north of $700 billion this year, up more than 80%, funded out of cash flow rather than junk debt. Furthermore, the hyperscaler capex is REAL. The question was never whether the spending exists. The question is what you pay to own the earnings it produces.
However, the real risk to the bear case lies in the sentiment. You have a market compounding 30% earnings growth, and investors are positioned as if a recession just started. Sentiment across both the AAII survey and Goldman’s own indicator sits firmly bearish. Nasdaq-100 short interest is up 35% since June. A sharp third-quarter de-grossing has pushed fundamental long/short net leverage into the 6th percentile of the past year, gross tech exposure sits in the 43rd percentile, and roughly $163 billion in cash is parked on the sidelines waiting for a pullback that refuses to arrive.
Of course, the obvious is: “If everyone is already bearish, isn’t that itself the bullish tell?” The answer to that is “mostly, yes.” Strong earnings, light positioning, elevated shorts, and a mountain of idle cash are the exact ingredients of a “pain trade” that grinds higher and forces the underinvested to chase. Such is the setup that keeps me long into the highs even while I distrust them.
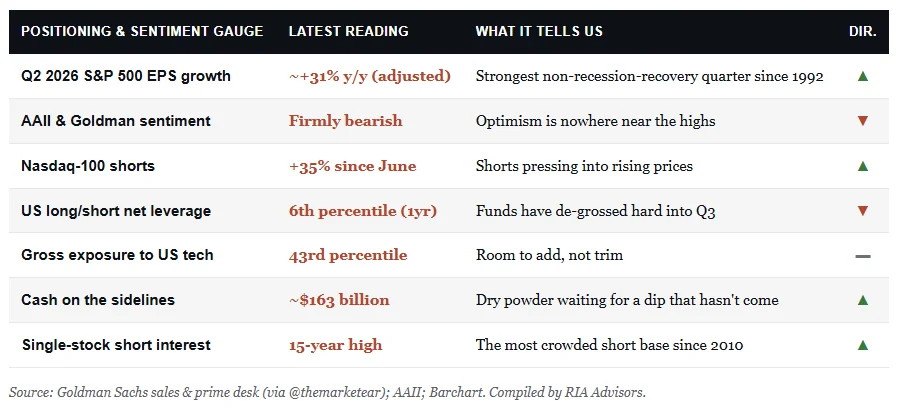
Market positioning and sentiment
A good example is that single-stock short interest just hit its highest level in more than fifteen years. Every one of those shorts is a future buyer the moment the tape refuses to break. That’s fuel, not a warning, at least for now.
The US dividend yield has fallen to around 1%, well below the rest of the developed world and the second-lowest in our core coverage universe. The dividend yield is solidly lower than the nominal 10-year Treasury yield, with the spread at its lowest level since 2002. Even the utilities sector now yields 1.8 percentage points less than 10-year Treasuries, near the widest deficit since 2007, diminishing the sector’s traditional appeal as a stable source of income.
Strong momentum in EPS revisions continues to be supportive of equities. Tech-sector profit margins are at structural and cyclical highs, driving much of the upside in listed-company profitability. The consensus EPS estimate for global equities has taken flight.
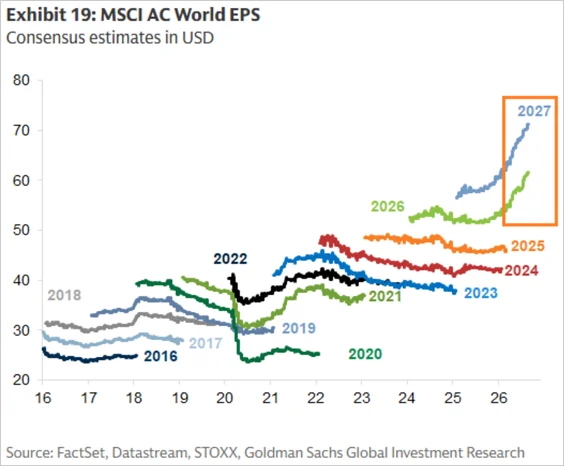
Global EPS consensus estimates. Source: FactSet, Goldman Sachs Global Investment Research
US earnings have broken out of a 90-year channel.
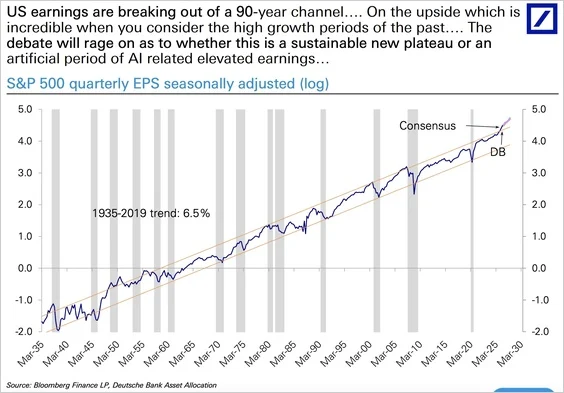
US earnings breaking out of a 90-year channel. Source: Deutsche Bank, Bloomberg
Hyperscalers and AI infrastructure companies accounted for roughly half of S&P 500 EPS growth in Q2, but earnings strength broadened considerably, with ex-energy profits for the rest of the index posting a solid 14% year-over-year gain. US earnings upgrades have outpaced cuts for 21 consecutive weeks—the longest streak since 2021.
The Russell 2000 fell below its 100-day moving average.
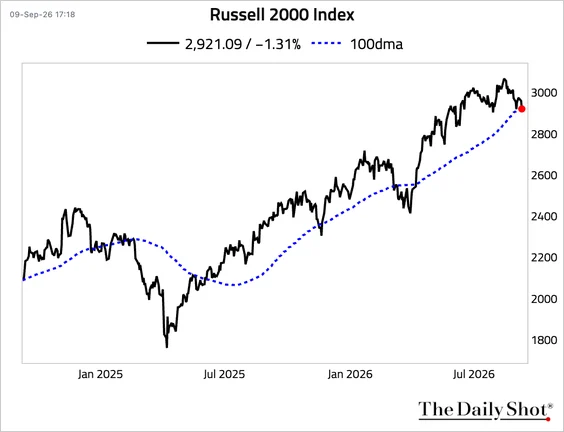
Russell 2000 below its 100-day moving average. Source: The Daily Shot
The small-cap universe has changed substantially, with 61% of constituents new since 2013 and the share of loss-making companies rising from 13% in the late 1990s to roughly 40% today, partly reflecting growth in biotech listings and the 2021 SPAC boom.
Great Quotes
“Once markets believe Treasury is defending a price, every rise in yields becomes a test of official resolve, and the operations must grow to survive the tests.”
— Stan Druckenmiller
Picture of the Week
Franconia Notch State Park, New Hampshire

All content is the opinion of Brian Decker