


The September jobs report showed just 29,000 new jobs, and the unemployment rate ticked up to 4.2%. In this week’s feature, we look at breakeven job growth estimates from the Federal Reserve, the St. Louis and Dallas Fed banks, and Brookings. Two years ago, those estimates averaged roughly 190,000 jobs a month. Today, the average is about 25,000. We also cover the US-China tariff plan, business investment and construction data, and Nvidia’s $150 billion buyback increase.
US Economy
Here’s a summary of the statements released by the US and China after the Trump-Xi summit.

US and China summit statements
The US and China detailed plans to cut tariffs on about $30 billion in imports from each country, including Chinese consumer goods and US agricultural products, coal, and medical equipment.
Stripping out transportation, growth in orders decelerated for a third month to 0.3% month over month, suggesting that the earlier boost from firms stockpiling ahead of potential supply chain disruptions may have run its course. Core capital goods orders, which exclude defense and aircraft, continued to boom, signaling solid underlying momentum for business investment. Shipments of computers and electronic products were little changed month over month, but year-over-year growth remained strong.
Business fixed investment (BFI) has been a meaningful contributor to GDP growth, and the Atlanta Fed’s GDPNow model points to a further acceleration in the third quarter.
The Dallas Fed manufacturing survey showed output growth accelerating sharply in September. The new orders index also jumped, suggesting a robust demand pipeline. Employment improved, though future expectations softened meaningfully. The ISM manufacturing PMI edged lower but remained in a solid expansion. The S&P Global Manufacturing PMI was revised down but still signaled the strongest expansion since mid-2022, fueled by solid domestic new orders and robust hiring.
Soaring transport costs are set to bleed through to virtually all corners of the US economy, with contract trucking rates surging to their highest level since the pandemic. A proposed 90-day ban on US diesel exports could cut diesel prices and associated transportation costs, but lower refinery runs could raise gasoline and jet fuel prices, according to Oxford Economics.
Construction spending rebounded. The gain was broad-based across residential and nonresidential spending. Construction spending on data centers is going parabolic, and the year-over-year growth rate has accelerated sharply. Mortgage rates rose to the highest level since November 2023.
The pass-through of tariffs to consumer prices is mostly done, according to Goldman Sachs. Financial conditions have tightened a bit recently, driven almost entirely by the increase in long bond yields.
The net effect on overall GDP is muted. Looking beyond the second quarter, the Atlanta Fed’s GDPNow model is now tracking Q3 GDP at 3.7%.
America’s housing glut is concentrated in the South, where the number of new homes for sale is comparable to the level of supply during the housing bubble.
Job openings fell more than expected in August, pointing to a moderation in labor demand. This chart shows the changes in job openings by industry.
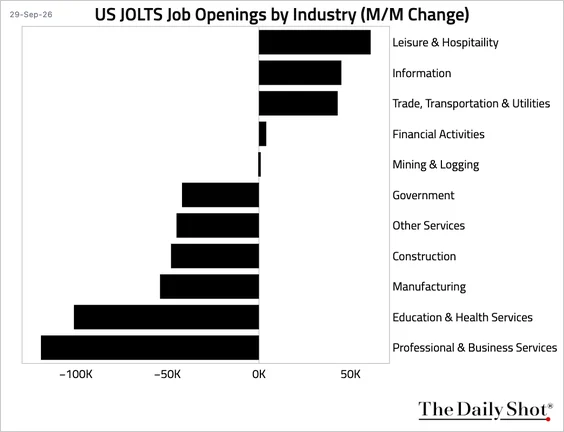
Job openings by industry, August
The jobs-workers gap, which measures the difference between labor supply and labor demand, remained near equilibrium.
US Stock Market
S&P 500 breadth has narrowed to its weakest level since the dot-com bubble. The share of stocks beating the S&P 500 over the past decade has steadily declined. The S&P 500’s elevated free cash flow (FCF) valuation partly reflects unusually heavy capex. This chart compares price/FCF with price/operating cash flow, with the latter adding back capex.
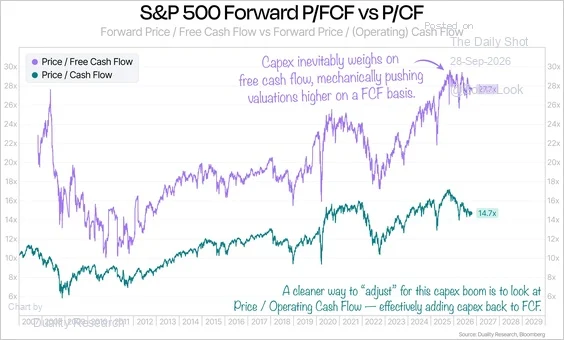
S&P 500 cash flow valuations
Source: Duality Research
Foreign investors made record net purchases of US equities in the second quarter, while net purchases of debt securities slowed.
Semiconductor gross margins have surged to multidecade highs, with memory-chip margins near 80%—more than double their historical average—and consensus expects profitability to remain elevated through 2028. Gross margin expansion is expected to drive about a quarter of semiconductor earnings growth this year. Tech sector earnings have risen 38 times more than non-tech sectors since 2010.
The relentless upward revision of 2026 EPS forecasts has stalled. Long-term earnings-growth expectations have continued to rise even as near-term expectations have plateaued.
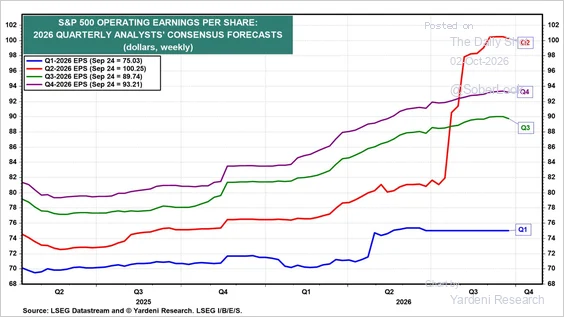
2026 earnings estimates by quarter
Source: Yardeni Research
Nvidia is launching the largest buyback in US corporate history, a $150 billion increase that lifts its total buyback authorization.
The percentage of S&P 500 stocks above their 50- and 200-day moving averages has plunged.
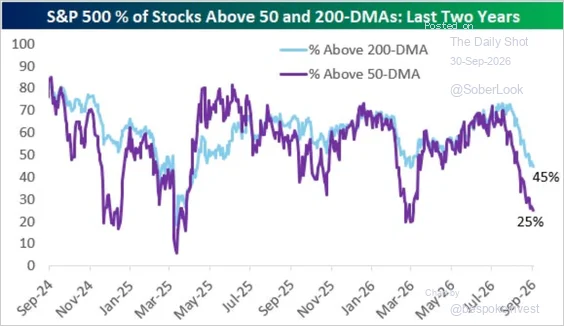
Fewer stocks above key moving averages
Source: @bespokeinvest
On Tuesday, President Donald Trump hosted a luncheon with executives from many of the largest AI and technology companies.
At the event, Trump said that he and the executives had signed a “morally binding” agreement to commit to AI safety. And he added that the White House is considering building a 10-person committee to oversee AI companies.
The lunch was a “who’s who” of the AI industry. It included executives from the AI firms Anthropic and OpenAI… hyperscalers like Alphabet, Meta, Amazon (AMZN), and Microsoft (MSFT)… and chipmakers like Nvidia (NVDA) and Advanced Micro Devices (AMD).
Financial commentator Gannon Breslin shared the seating chart from the event in a post on X…
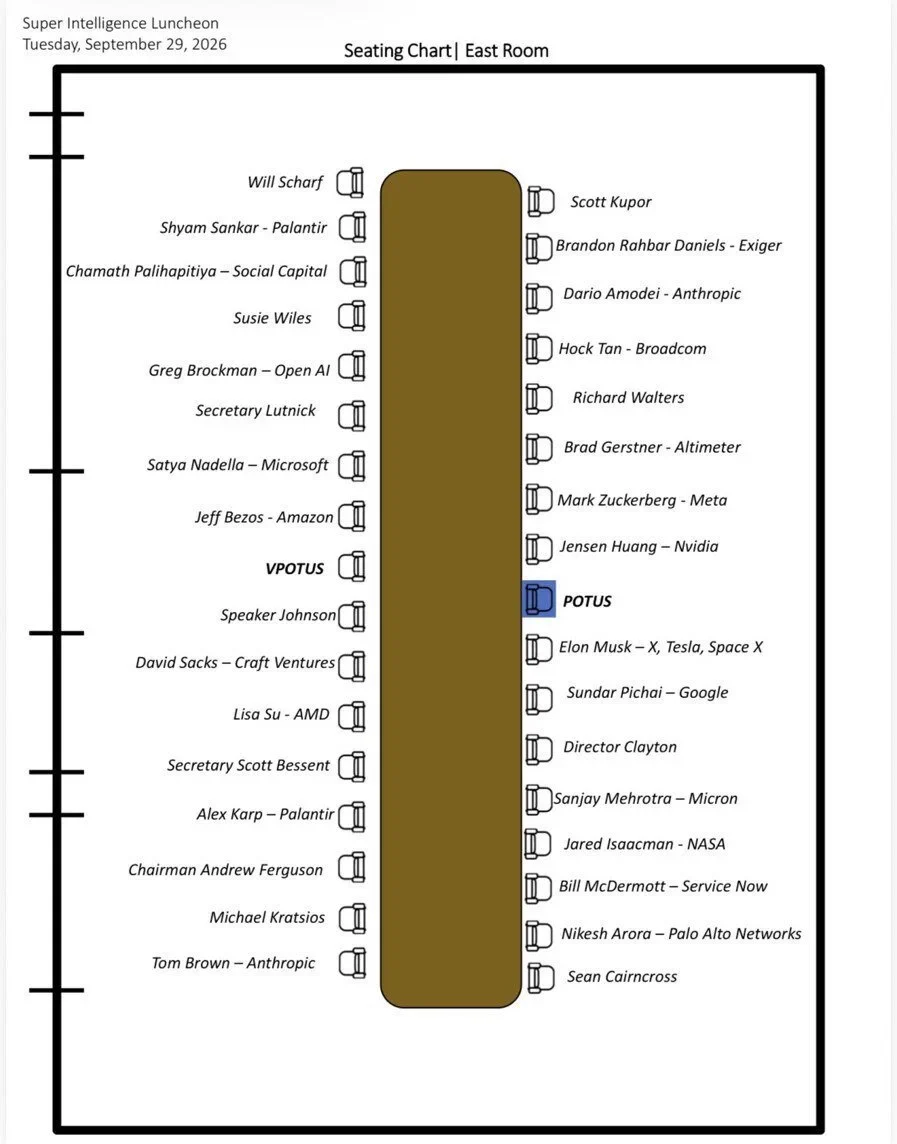
White House AI luncheon seating chart
If you’re looking for which companies are going to be the big winners from AI, they were likely in this room.
These were the most visited North American national parks in 2025.
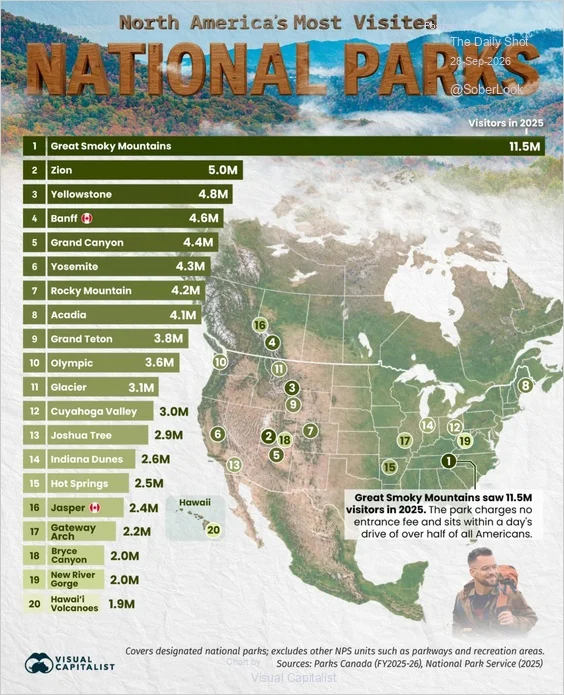
Most visited national parks, 2025
After decades of tuition increases that far outpaced inflation, some colleges are beginning to cut sticker prices.
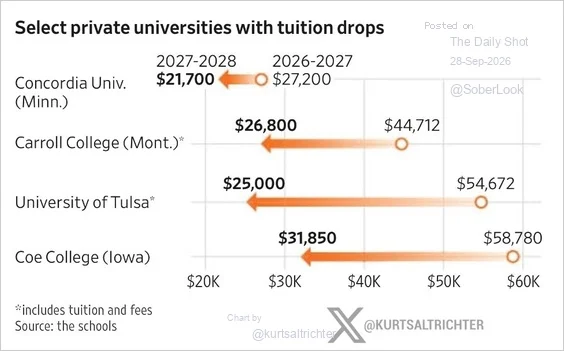
Some colleges cut sticker prices
Source: @kurtsaltrichter
Men are more likely than women to watch women’s sports regularly.
Every US state has higher household final consumption per capita than any country outside the United States.
How does El Niño affect weather around the world?

How El Niño affects global weather
Here’s a look at US GDP growth by state.
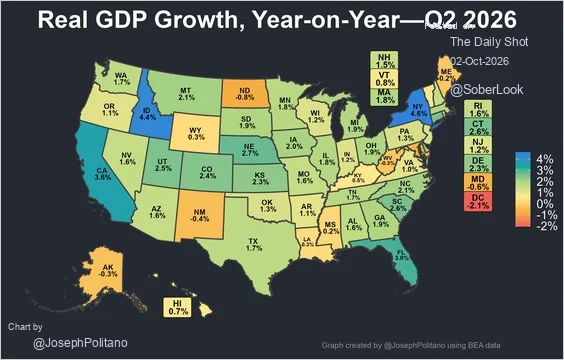
GDP growth by state
Source: @JosephPolitano
What are the world’s most- and least-taxed countries?
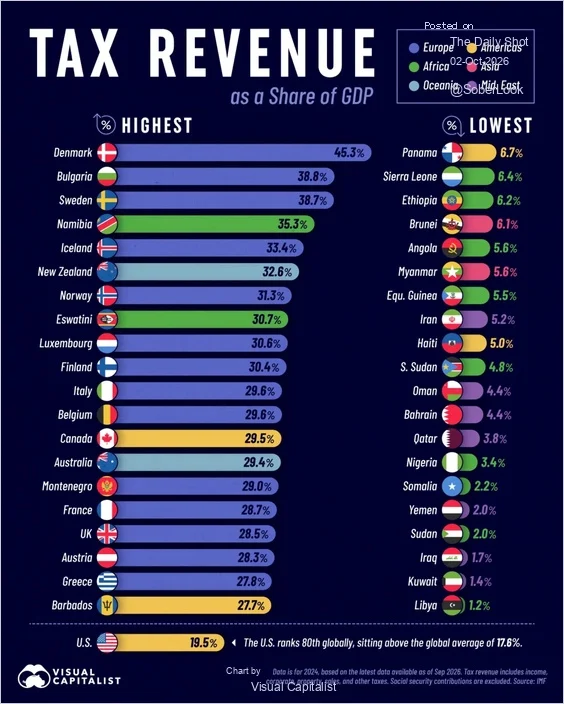
Most- and least-taxed countries
The Fed
September job growth came in far below the expected 90,000 figure. Peter Boockvar says this likely rules out another Fed rate increase this month.
Key Points:
- Payroll growth was softer than expected, rising by only 29,000 in September. The prior two months were revised down by a combined 60,000, too.
- The separate household survey showed stronger growth but still didn’t keep up with a rise in the labor force. This made the unemployment rate tick up to 4.2%.
- Job gains were led by the healthcare/social services, trade/transport/warehousing, and leisure/hospitality sectors, with smaller gains seen in construction and manufacturing.
- Information technology, financial services and business services all saw job losses.
- Smoothing out the monthly noise, 12-month average job growth is now 41,000. For perspective, this number was 165,000 in 2019.
- The “breakeven” job growth number remains unclear, though it is certainly lower now. Some estimates are around 50,000, which would mean the current 12-month average is in range.
Treasury yields fell after this news release. Mild job growth suggests inflation may not be as persistent or severe as some think. This might allow long-term rates to ease somewhat.
Torsten Slok of Apollo notes that breakeven job growth has collapsed from 200,000 per month to close to zero today, driven by a sharp drop in immigration shrinking labor force growth and continued baby boomer retirements pulling down participation. The graph below shows how much things have changed among economic observers in just the last two years.
These are estimates of what the breakeven job growth would be to keep the unemployment rate steady. These estimates are from the Federal Reserve, the Federal Reserve Banks of St. Louis and Dallas and the Brookings Institute. Two years ago, the average breakeven estimate among these four was roughly 190,000 jobs. That’s a tall order. Today it is 25,000 jobs, and the 29,000 jobs print, which historically seems quite weak, is in line with a steady unemployment rate. Which is exactly what we got.
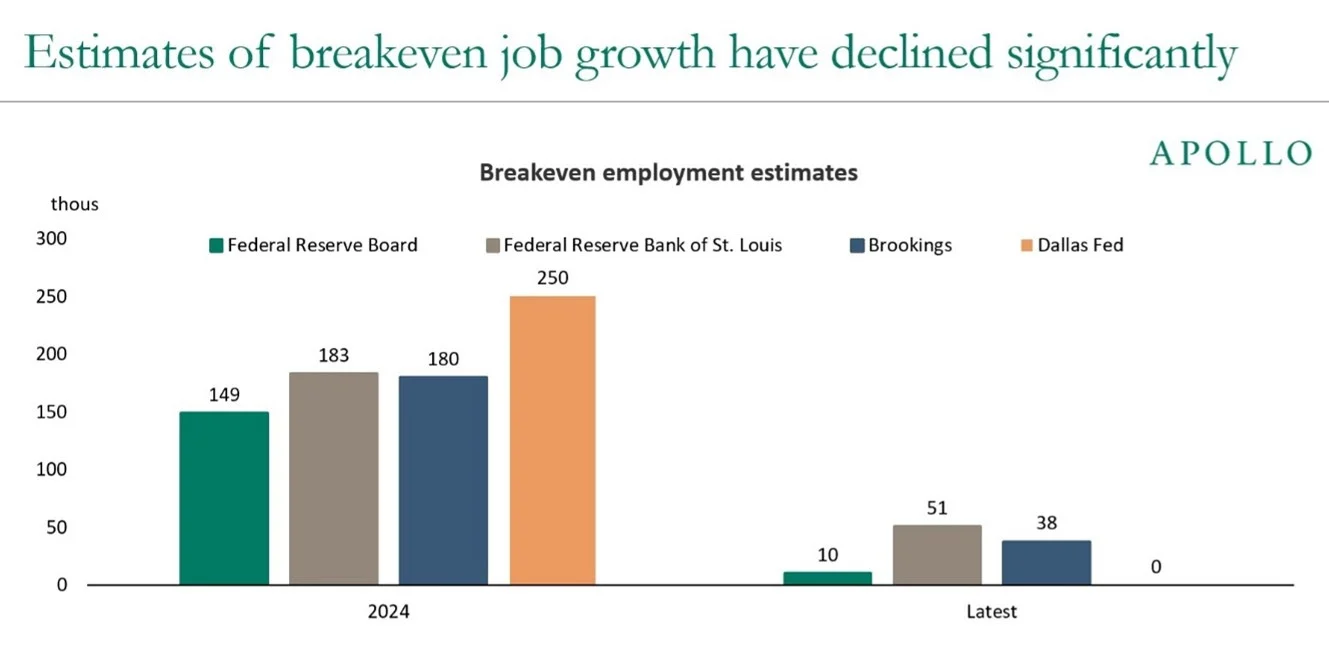
Breakeven job growth estimates have fallen
Source: Apollo Global Management
This is mostly a function of immigration reducing the labor force and baby boomers retiring in ever greater numbers. Eventually (as in a year or two) the immigration overhang gets worked out. And then I would expect the breakeven number to increase. But back to 200,000 new jobs every month? I am not sure that’s in the cards.
Great Quotes
“Governments defending prices against fundamentals always lose. The only variable is how much they spend before conceding.”
– Stanley Druckenmiller
Picture of the Week
Dramatic Reynisfjara Black Sand Beach in Iceland

Reynisfjara Black Sand Beach in Iceland
All content is the opinion of Brian Decker








Leave A Comment