


This week’s US economy and stock market roundup covers initial jobless claims, where the four-week average fell to its lowest level since 1969, and S&P 500 third-quarter earnings growth, which is on track to exceed 30%. It also looks at how Treasury yields, the dollar, and gold reacted to the midterm results, the Atlanta Fed’s 3.4% GDPNow estimate, job openings, factory orders, manufacturing activity, productivity, homebuilder costs, precious metals, and market breadth.
US Economy
Democrats won control of both the House and Senate in a sweeping midterm victory. S&P 500 futures initially sold off but have since rallied back. Treasury yields slipped. The dollar weakened, while the Mexican peso appreciated sharply. Gold jumped.
The Atlanta Fed’s GDPNow model is now tracking Q4 GDP at 3.4%, down from 3.7% on Monday.
The September JOLTS report showed a rebound in job openings, exceeding consensus expectations. Layoffs remained low, while quits increased, signaling a modest improvement in worker confidence.
Factory orders rose more than expected in September. Orders excluding transportation also accelerated. In level terms, factory orders excluding transportation have been strong. Redbook same-store sales growth accelerated.
Homebuilders face mounting materials costs.
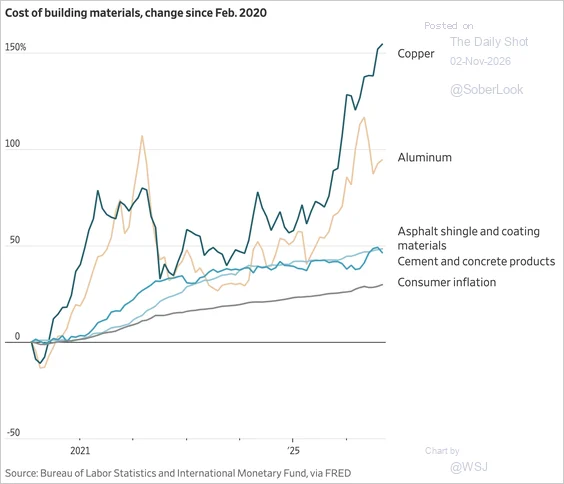
Cost of building materials, change since Feb. 2020. Source: Bureau of Labor Statistics and IMF via FRED. Chart: WSJ.
Residential construction services costs, particularly transportation and warehousing, have climbed to record highs, adding to cost pressures on homebuilders. Regulatory costs for US single-family home construction have risen across nearly every category, with building-code changes accounting for the largest increase.
Where does each state get its tax revenue?

Each state’s biggest tax revenue source. Source: U.S. Census Bureau. Chart: Visual Capitalist.
The ISM manufacturing PMI rose, signaling an acceleration in factory activity. The final S&P Global manufacturing PMI was revised lower but continued to signal robust expansion. While the relative importance of business spending on tech goods and data centers is not wildly out of line with history, the speed of the increase is unprecedented.

Investment in computers, telecom equipment, and data center construction vs. GDP. Source: Bureau of Economic Analysis, Matthew Klein’s calculations.
Initial jobless claims fell to 189,000, well below consensus. The four-week moving average declined for the third consecutive week, reaching its lowest level since 1969. While continuing claims edged up, the broader trend has been stable.
Nonfarm labor productivity surged in Q3, well above consensus, with accelerating efficiency gains observed in sectors with high AI adoption, such as finance, information, and professional services.
US Stock Market
More than halfway through the earnings season, S&P 500 Q3 earnings growth is on track to exceed 30%.

S&P 500 earnings growth, Q3 2026. Source: FactSet.
Growth in forward EPS remains strong.
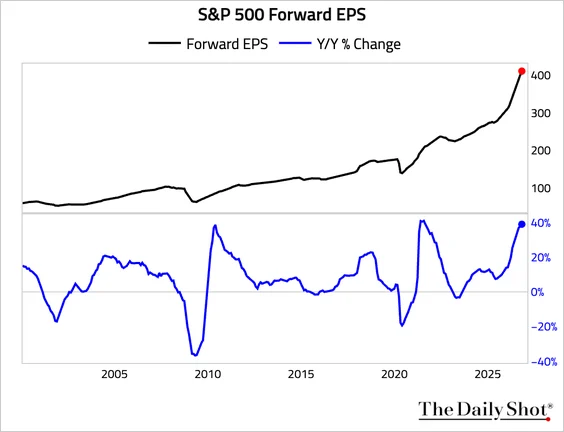
S&P 500 forward EPS. Source: The Daily Shot.
Precious metals continue to struggle.
– Gold (lowest since October 2025):

Gold futures. Source: The Daily Shot.
– Silver (lowest since November 2025):

Silver futures. Source: The Daily Shot.
The S&P 500 typically sees three 5% corrections per year and one 10% correction. So far this year, there has been only one 5% pullback, and the last 10% correction occurred in spring 2025. We are leaving the historically worst six months for the S&P 500 and entering the historically best six.

The best six months of the year are here. Source: Carson Investment Research, FactSet.
Market breadth has improved more sharply in the S&P 500 than in the Nasdaq 100, as measured by the share of constituents above their 200-day moving averages. The share of S&P 500 constituents outperforming the index over the trailing month has risen from 17% to 74% in just a few weeks.
Great Quotes
“There’s no chance that the iPhone is going to get any significant market share. No chance.”
– Steve Ballmer
Picture of the Week
Paraglider flying at Fethiye over Blue lagoon in Oludeniz, Turkey

Paraglider flying at Fethiye over Blue lagoon in Oludeniz, Turkey












Leave A Comment