


This week’s roundup covers the U.S. economy and the stock market. The unemployment rate edged up to 4.18%, while the four-week average of initial jobless claims fell to its lowest level in four years and the Atlanta Fed’s GDPNow model is tracking third-quarter growth at 3.6%. Data shared by Visual Capitalist show the U.S. spends about 10.6% of its budget on interest payments, second only to Mexico among developed, market-based economies. On the market side, the bull market that began in October 2022 reaches its four-year anniversary and technology stocks set another record high. Several U.S. exchanges also plan overnight sessions starting December 6 that would bring trading to 23 hours a day. The roundup also looks at bank fundamentals, earnings revisions by sector, global market breadth, and how the S&P 500 has performed around past midterm elections.
US Economy
The unemployment rate rose by three basis points to 4.18%,
reflecting a 406,000 increase in household employment and a larger 485,000 increase in the size of the labor force. The civilian labor force participation rate ticked up, driven by a rebound in prime-age participation. The underemployment rate (U-6) fell 10 bps to 7.6%.
Factory orders edged up, supported by another increase in orders excluding transportation, which remain at historically elevated levels.
The United States is spending about 10.6% of its budget on interest payments for debt alone – just barely below Mexico’s 10.9% for the highest percentage among the world’s most developed, market-based economies, as the folks at Visual Capitalist recently shared…
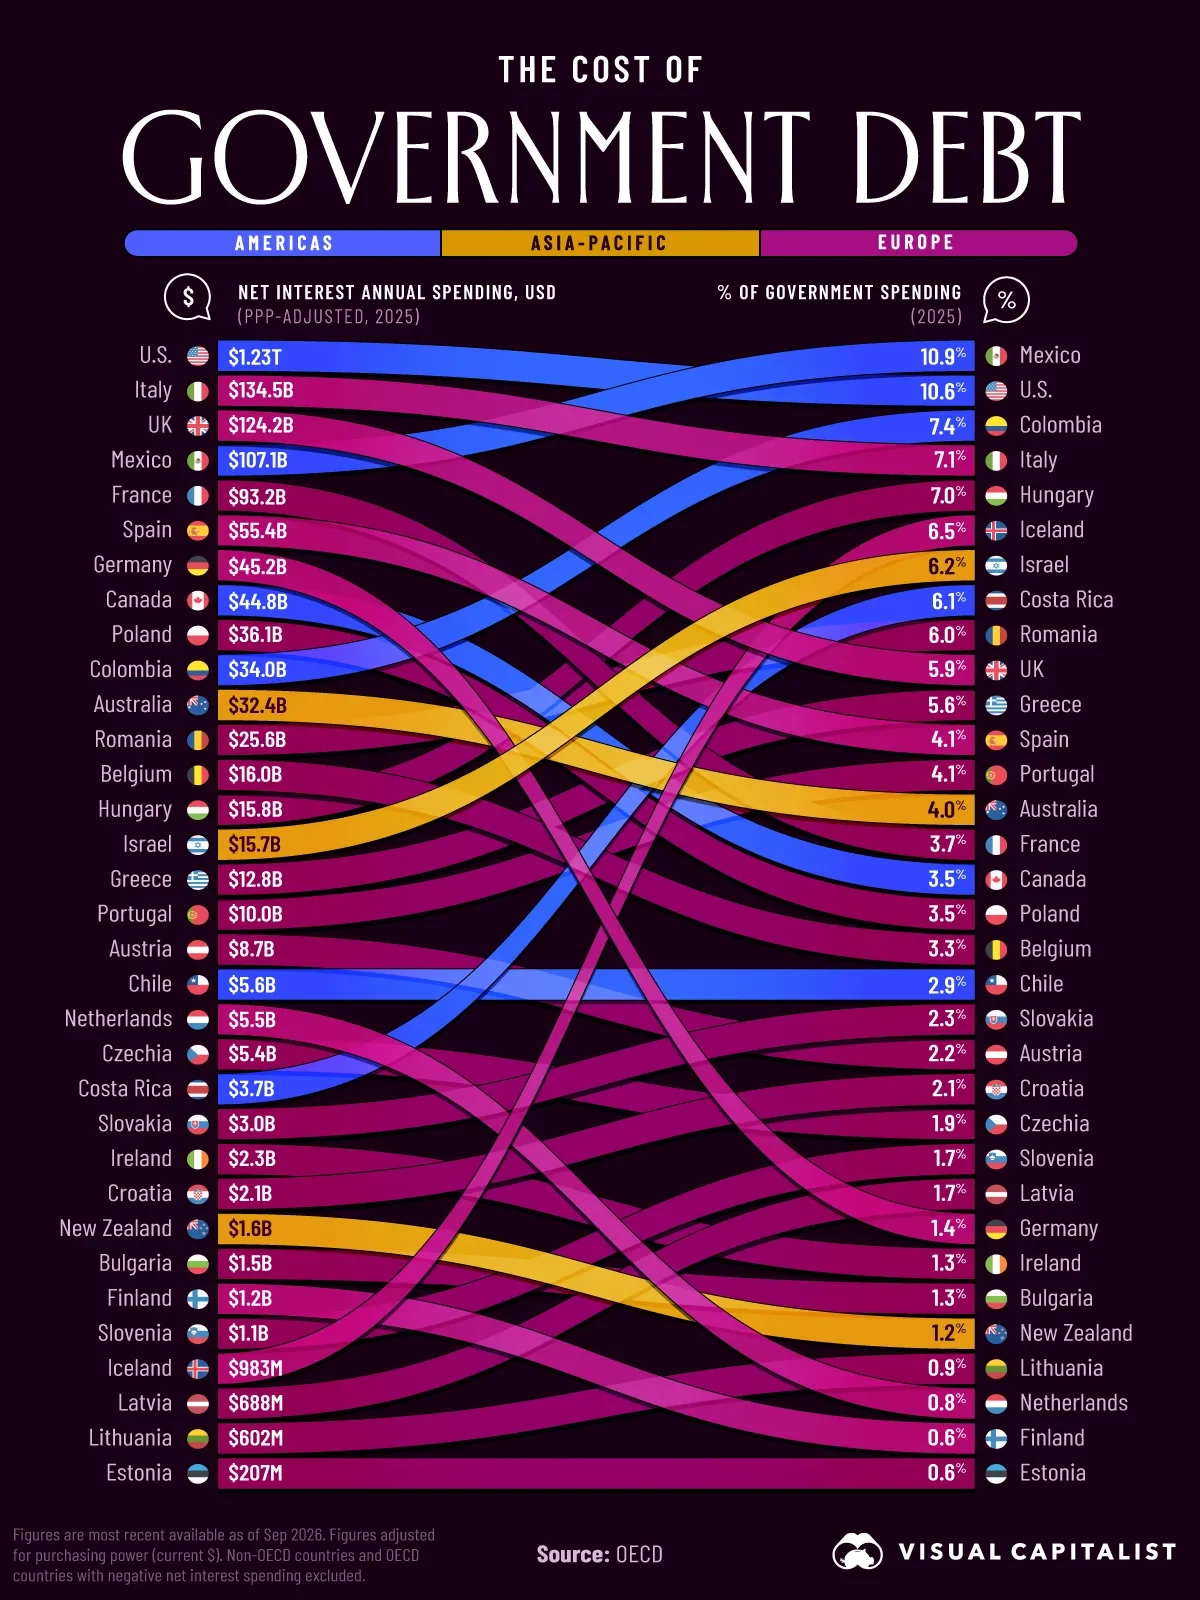
Source: Visual Capitalist, using OECD data.
The ISM Services PMI eased but continued to expand at a robust pace. All components were in expansion. The business activity index moderated. The new orders component also eased but remained solid.
The Backlog of Orders Index rose, indicating that demand is outpacing capacity. Price pressures jumped to their highest level since July 2022. The S&P Global Services PMI was revised up slightly and signaled strong expansion in the sector.
Economic activity has remained resilient despite headwinds from the dollar, oil prices, and bond yields.
Let’s start with some updates on banks.
Fundamentals look robust.
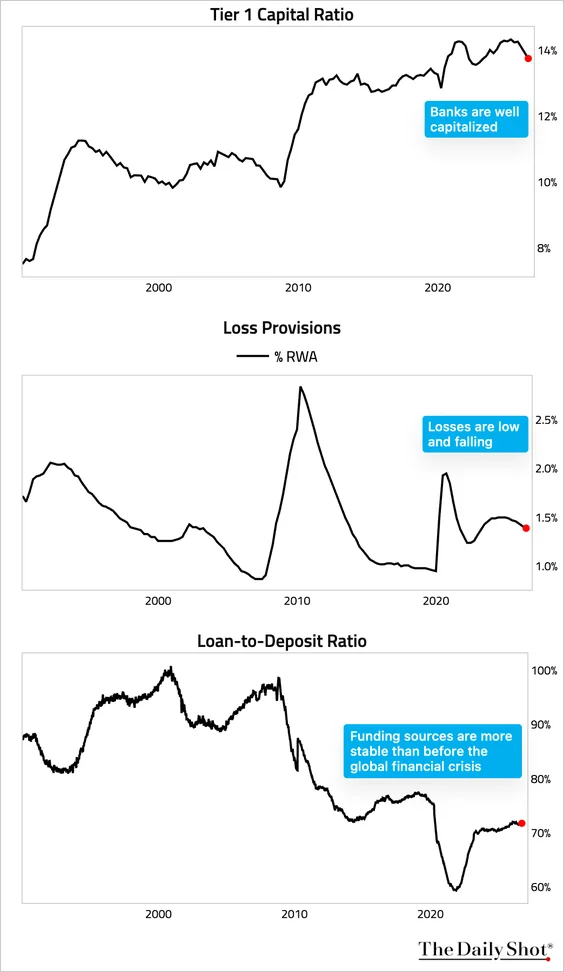
Source: The Daily Shot.
Earnings are at record highs, and returns on equity have been improving. Lending standards are still favorable.
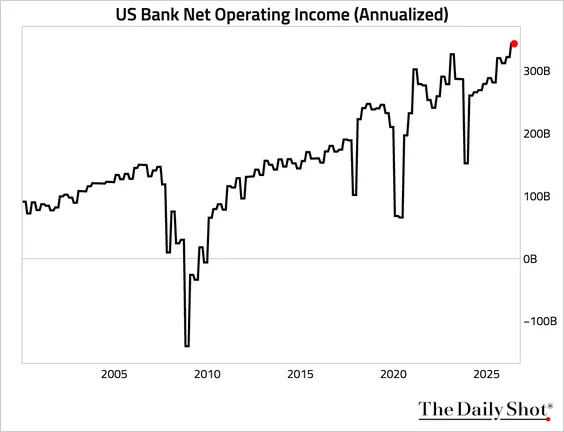
Source: The Daily Shot.
The trade deficit widened, driven by imports climbing to a record high. AI-related capital goods imports remain the star of the show. Redbook same-store retail sales growth picked up in the week ending October 3. The RCM/TIPP Economic Optimism Index improved more than expected. Corporate pricing power has accelerated since mid-2025 while unit labor costs have remained subdued, widening margins and boosting profits.
Here’s a long-term look at the highest and lowest tax brackets.
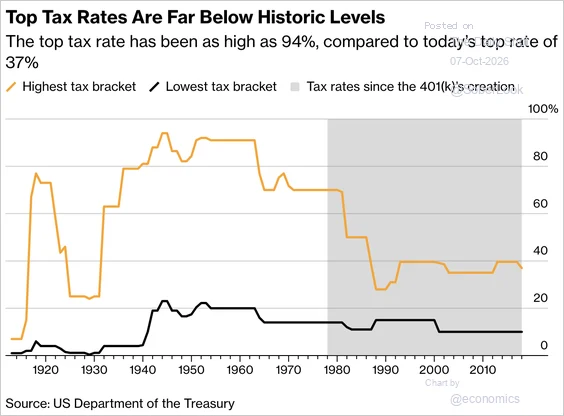
Source: U.S. Department of the Treasury, via Bloomberg.
Source: @economics Read full article
Child mortality has declined in all world regions.
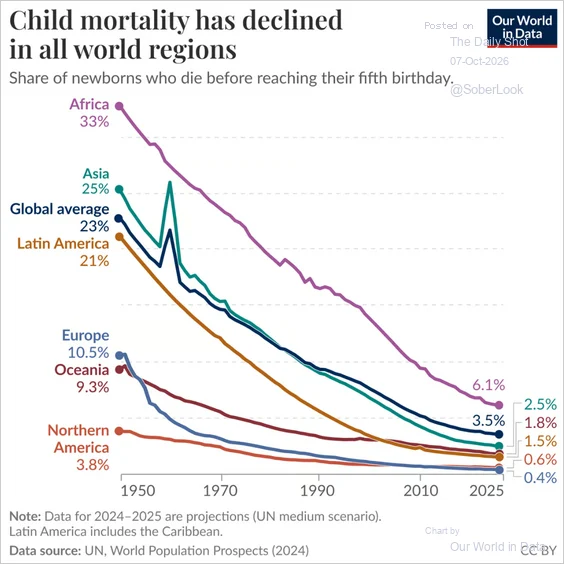
Source: Our World in Data, UN World Population Prospects (2024).
Initial jobless claims edged lower, pulling the four-week moving average down to the lowest level in four years. Continuing claims edged up but remained low. The number of states with initial claims rising over 20% year over year remains low. The GDPNow model is tracking Q3 GDP at 3.6%, down from 3.7% on Tuesday. Underlying domestic demand remains strong. Real final sales to domestic purchasers, which remove volatile inventories and net trade, are solid at 4.3%. Excluding government spending, real final sales to private domestic purchasers are forecast at 4.6%. Healthcare’s contribution to GDP growth has been unusually strong in recent years, partly reflecting an aging population.
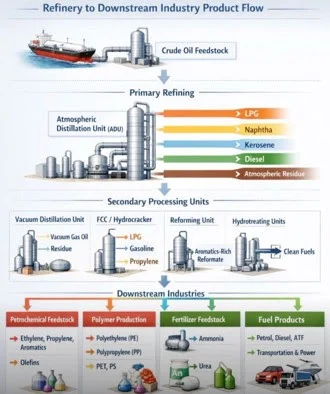
There are literally hundreds of products that we use every day that come from that barrel of oil. Plastics, fertilizer and so on. Just look at this chart and get a small idea of all the products that are made from that barrel of oil. This whole process, and especially the refinery complex, is weighing on everything we buy and use.
US Stock Market
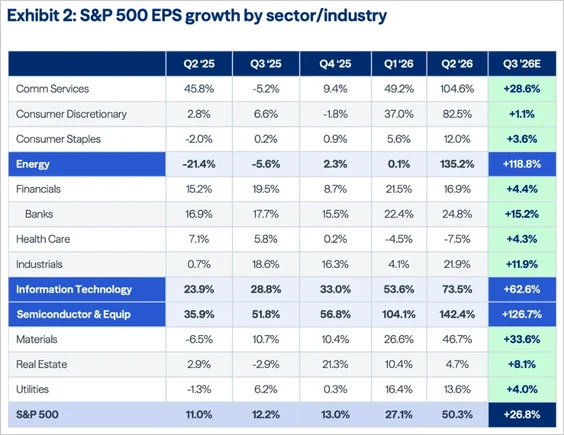
The technology sector has reached another record high, as has its ratio to the S&P 500. US forward earnings continue to rise across market caps. Bottom-up consensus estimates show S&P 500 EPS growth of 27% year over year in Q3 2026.
Several US exchanges are moving to 23-hour trading, with new overnight sessions from 9 p.m. to 4 a.m. ET scheduled to begin December 6 to capture foreign demand.
Earnings revisions remain robust, particularly in the US and EM.
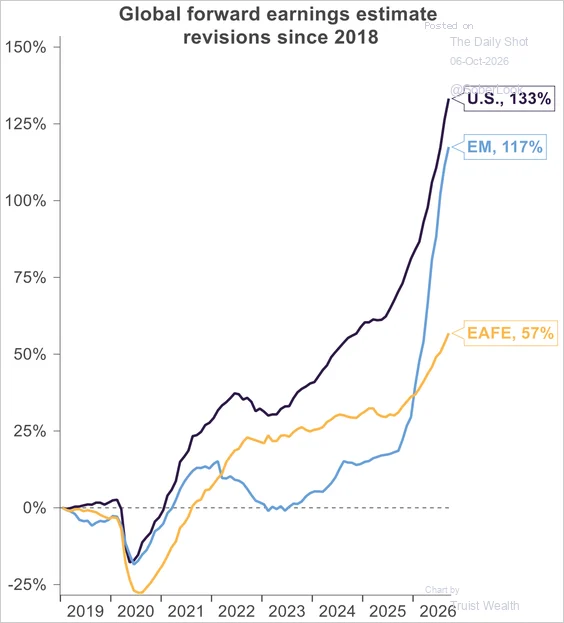
Source: Truist Wealth, via The Daily Shot.
How has the S&P 500 performed under different configurations of partisan control?
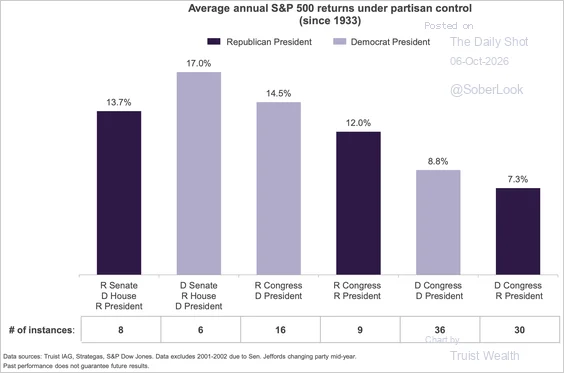
Source: Truist Wealth. Data from Truist IAG, Strategas, S&P Dow Jones.
Source: Truist Wealth
Global market breadth has deteriorated sharply, with fewer than half of country markets above their 50- and 200-day moving averages. The number of stocks making new lows is surging, with new lows outnumbering new highs for more than a month.
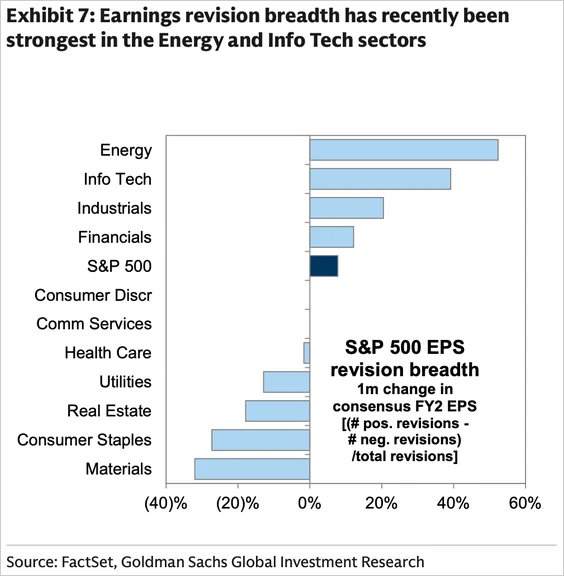
Earnings revision breadth has been the strongest in energy and tech.
Source: FactSet, Goldman Sachs Global Investment Research.
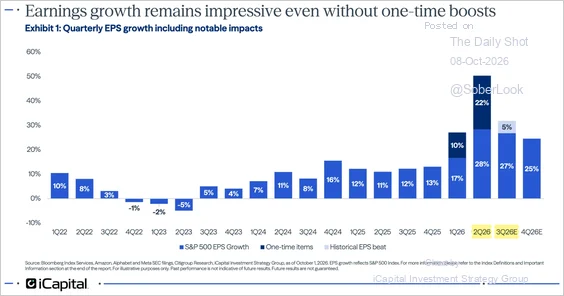
Q3 margin estimates have been revised lower in every sector except tech. Last quarter delivered the strongest S&P 500 earnings growth of this century outside postcrisis rebounds, although roughly 22 percentage points came from one-time gains, leaving underlying growth near 28%. Consensus estimates point to a moderation in Q3 earnings growth, with less assistance from unusual gains.
Source: iCapital Investment Strategy Group.
Source: iCapital Investment Strategy Group Read full article
Here’s a look at EPS growth by sector or industry.
Source: Not shown on image. Confirm before publishing.
The current S&P 500 bull market, which began in October 2022, is reaching its four-year anniversary. Of the six previous bull markets that lasted at least four years, five gained further ground in their fifth year, with an average fifth-year return of 12%. The S&P 500 has rallied in the three-month window surrounding midterm elections in 21 of the past 23 election years, with a median gain of 7%; the two exceptions coincided with interest-rate concerns.
Great Quotes
“The first rule of compounding is to never interrupt it unnecessarily.”
— Charlie Munger
Picture of the Week
Gwangan Bridge, Busan, South Korea

All content is the opinion of Brian Decker










Leave A Comment