
The Federal Reserve meets Wednesday in what may be the most difficult policy moment since the rate-cutting cycle began. Oil has crossed $100 a barrel, the economy shed 92,000 jobs last month, and Q4 GDP came in at just 0.7%. The Fed can’t cut without risking inflation — and it can’t hold without deepening the jobs crisis. This week’s full breakdown covers what the dot plot, the PPI, and the Hormuz standoff mean for your retirement portfolio.
In This Article
US Economy
Nonfarm payrolls unexpectedly fell by 92,000 in February — well below estimates of a 55,000 gain. Private payrolls fell by a similar 86,000, the largest decline since December 2020, partially driven by poor weather and the 31,000 nurses and other healthcare professionals who were on strike.
The Atlanta Fed’s GDPNow model is now tracking Q1 GDP at 2.1%, down from 3.0% on March 2 — a meaningful deceleration in the near-term growth outlook that will weigh on the Fed’s calculus this week.
US Stock Market
Despite the deteriorating macro backdrop, analysts’ forecasts for 2026 corporate earnings remained solid. Earnings estimates have not yet been meaningfully cut in response to the Iran conflict — a relative bright spot for bulls, though one that carries its own risk if the macro data continues to deteriorate.
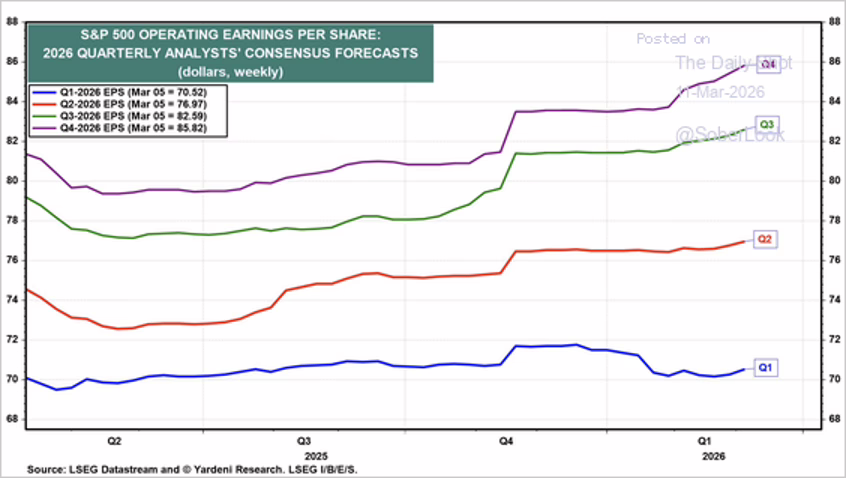
Analyst consensus forecasts for S&P 500 earnings remain on an upward trajectory through 2026, though Q1 estimates have drifted lower in recent weeks. Source: Yardeni Research / LSEG Datastream.
Source: Yardeni Research
The Fed
The Federal Reserve takes center stage this week. The March 17–18 FOMC meeting is the most consequential policy event since the rate-cutting cycle ended, and it arrives at the worst possible moment for a central bank navigating stagflation risk.
The data entering the meeting is unambiguous in its difficulty: February payrolls shed 92,000 jobs — the third negative print in five months — while wages accelerated to 3.8% annually. Oil is pushing $100 on the Iran conflict. Core PCE is running at 3.0%. The labor market is weakening, and inflation is reaccelerating. That’s the textbook definition of a policy trap.
The rate decision itself is a foregone conclusion. CME FedWatch shows a 92%+ probability of a hold at 3.50–3.75%. The real market-moving event is the dot plot and the Summary of Economic Projections.
- If the median dot shifts to zero cuts: rate expectations reprice violently and risk assets sell off.
- If dots shift to two cuts, acknowledging labor deterioration: bonds rally and equities catch a bid.
Two dissenters in January — Waller and Miran — already preferred a cut, suggesting internal pressure is building. Powell’s press conference carries added weight as one of his final appearances before his term expires May 23, with hawkish-leaning Kevin Warsh the expected successor.
Wednesday morning’s PPI lands just hours before the FOMC decision, creating a rare same-day inflation-plus-policy collision. Producer prices will signal whether upstream pipeline costs — oil, tariffs, and supply chain pressures — are building pressure that hasn’t yet reached consumers. A hot PPI followed by a hawkish dot plot would be the worst-case scenario for equity bulls.
Monday’s Empire State Manufacturing and Thursday’s Philly Fed surveys bracket the meeting with regional factory reads that will capture the first hard data on tariff and geopolitical disruption in the manufacturing sector. Both surveys’ price-paid components matter as much as the headline numbers.
Iran and World Oil
With the global economy experiencing an oil shock, it’s useful to look at what happened during previous shocks. The chart below shows crude oil prices with notable supply and demand events marked.
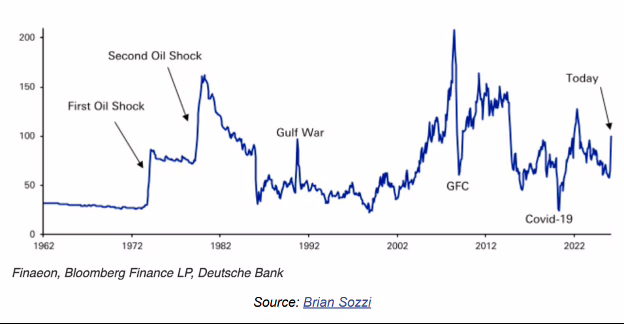
Oil is back near $100/barrel — a level last seen during the 2022 energy spike and, before that, the Global Financial Crisis. The current surge ranks alongside the most disruptive oil shocks in modern history. Source: Finaeon, Bloomberg Finance LP, Deutsche Bank.
If the current Iran conflict ends soon, the latest spike may resemble what happened in the 1990 Gulf War: a sudden surge that quickly reversed itself. Alternatively, in worst-case scenarios where hostilities intensify and the Strait of Hormuz stays closed for months, the outcome might look more like the First Oil Shock of the 1970s — a sharp spike followed by an extended equilibrium near the higher level. These scenarios would have very different economic impacts, and unfortunately there is no way to know which path we are on from here.
Most US consumers will first notice the oil shock when they buy their next tank of gasoline. The GasBuddy app — which draws on real-time pump prices reported by customers thousands of times per day — makes the latest spike readily apparent.
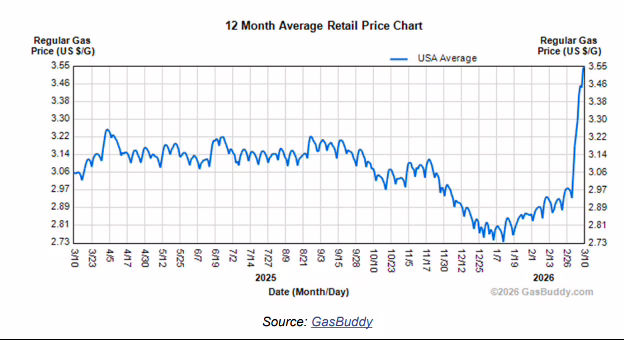
U.S. average gas prices have jumped to $3.46/gallon — the highest in over a year — as crude oil crosses $100/barrel. After months of relief at the pump, consumers are feeling the impact. Source: GasBuddy.
It’s also worth noting how steady gasoline prices were throughout 2025. The GasBuddy national average stayed mostly between $3.10 and $3.25 until October, when it began a slide that bottomed around $2.73 in early January. Prices then began climbing — perhaps reflecting early risk of a supply interruption. With gasoline prices now up around 30% from the January low, that risk was quite real.
The International Energy Agency agreed to release 400 million barrels of oil from strategic reserves — the largest coordinated drawdown on record — to stabilize the global supply disrupted by the Iran conflict and threats to shipping through the Strait of Hormuz.

Source: CNBC — Read full article
The United States separately announced plans to release 172 million barrels from the Strategic Petroleum Reserve.
Policy measures may have limited impact on oil prices unless safe passage through the Strait of Hormuz is secured. Escorting every tanker would require many warships and close allied coordination — but the US Navy has limited vessels available due to ongoing operations. The broader US strategy appears focused on degrading Iran’s asymmetric capabilities threatening shipping: coastal anti-ship missiles, naval mines, drones, and IRGC speedboat swarm attacks, as well as destroying the factories producing these systems. Once these threats are sufficiently reduced, naval escorts and government-backed insurance could restore confidence for tankers to transit the Strait.
Great Quotes
“The coldest winter I ever spent was a summer in San Francisco.” — Mark Twain
Picture of the Week
Finnish Lake
Picture of the Week: Lake Inari, Finland — stretching across 1,040 square kilometers of Finnish Lapland, Lake Inari is one of Europe’s largest lakes and among its most remote and unspoiled wilderness destinations.
The returns presented are historical and do not guarantee future results. Performance shown reflects model or composite strategy returns, is provided for informational purposes only, and does not reflect the actual performance of your individual portfolio. Performance shown reflects returns net of advisory fees. All investment strategies involve risk, including market volatility and the potential loss of principal. There is no guarantee that any investment objective will be achieved. All content is the opinion of Brian Decker.

